 | Lecture 9. Stability, Oscillations and Chaos in Population Dynamics |
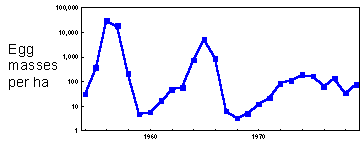
F1.Example: Gypsy moth population dynamics in Yugoslavia. Gypsy moth numbers increased by several orders of magnitude. Pest outbreaks resulted in forest defoliation in large areas. |
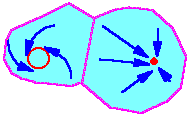
F2.Model trajectory converges to that attractor in which domain initial conditions were located. In this example, there are two attractors: a limit cycle (at the left) and a stable equilibrium (at the right). Domains of attraction are colored blue, they never overlap. For different starting places (initial conditions), trajectories converge to different attractors. |
Types of attractors |
Types of attractors |
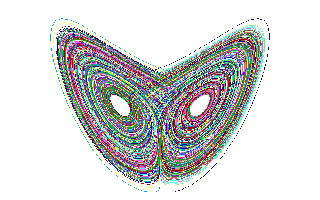
This is a chaotic attractor (Lorenz attractor) |
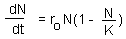
F3. To find equilibria we have to solve the equation: dN/dt = 0: |
This equation has two roots: N=0 and N=K. An equilibrium may be stable or unstable. For example, the equilibrium of a pencil standing on its tip is unstable; The equilibrium of a picture on the wall is (usually) stable. |
|
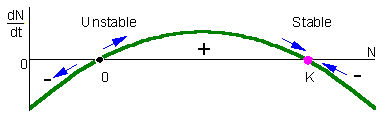
F4.examine stability of 2 equilibria points in the logistic model. In this figure, population growth rate, dN/dt, is plotted versus population density, N. This is often called a phase-plot of population dynamics. If 0 < N < K, then dN/dt > 0 and thus, population grows (the point in the graph moves to the right). If N < 0 or N > K (of course, N < 0 has no biological sense), then population declines (the point in the graph moves to the left). The arrows show that the equilibrium N=0 is unstable, whereas the equilibrium N=K is stable. From the biological point of view, this means that after small deviation of population numbers from N=0 (e.g., immigration of a small number of organisms), the population never returns back to this equilibrium. Instead, population numbers increase until they reach the stable equilibrium N=K. After any deviation from N=K the population returns back to this stable equilibrium.The difference between stable and unstable equilibria is in the slope of the line on the phase plot near the equilibrium point. Stable equilibria are characterized by a negative slope (negative feedback) whereas unstable equilibria are characterized by a positive slope (positive feedback). |
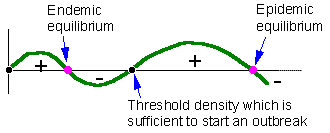
F5. The second example is the bark beetle model with two stable and two unstable equilibria.Stable equilibria correspond to endemic and epidemic populations. Endemic populations are regulated by the amount of susceptible trees in the forest. Epidemic populations are limited by the total number of trees because mass attack of beetle females may overcome the resistance of any tree |
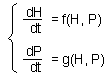
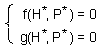
F6.This is the 2-variable model in a general form. Here, H is the density of prey, and P is the density of predators. The first step is to find equilibrium densities of prey (H*) and predator (P*). We need to solve a system of equations |
The second step is to linearize the model at the equilibrium point (H = H*, P = P*) by estimating the Jacobian matrix |
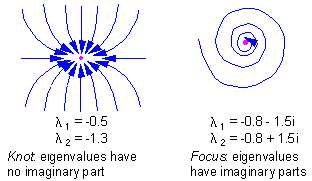
Third, eigenvalues of matrix A should be estimated. The number of eigenvalues is equal to the number of state variables. In our case there will be 2 eigenvalues. Eigenvalues are generally complex numbers. If real parts of all eigenvalues are negative, then the equilibrium is stable. If at least one eigenvalue has a positive real part, then the equilibrium is unstable. |
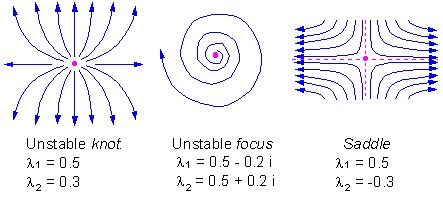
F7 - 2 types of stable equilibria in a two-dimensional space: knot and focus |
F8 -3 types of unstable equilibria in a two-dimensional space: knot, focus, and saddle |
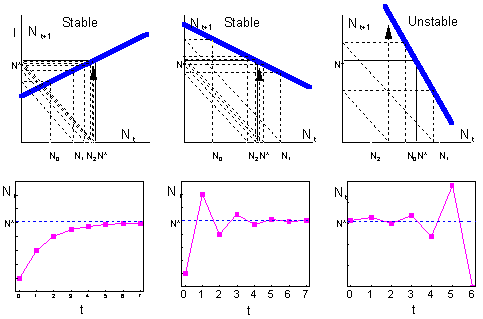
F9 -Consider a discrete-time model (a difference equation) with one state variable, This model is stable if and only if |
where |
is the slope of a thick line in graphs below |
Check - http://home.comcast.net/~sharov/PopEcol/xls/ricker.xls. If the slope is positive but less than 1, then the system approaches the equilibrium monotonically (left). If the slope is negative and greater than -1, then the system exhibits oscillations because of the "overcompensation" (center). Overcompensation means that the system jumps over the equilibrium point because the negative feedback is too strong. Then it returnes back and again jumps over the equilibrium. |
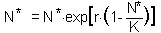
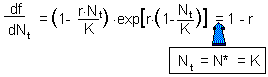
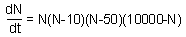
F10. the Ricker''s model. First, we need to find the equilibrium population density N* by solving the equation |
This equation is obtained by substituting Nt+1 and Nt with the equilibrium population density N* in the initial equation. The roots are: N* = 0 and N* = K.. We are not interested in the first equilibrium (N* = 0) because there is no population. Let''s estimate the slope df/dN at the second equilibrium point: |
Now we can apply the condition of stability:-1 < 1 - r < 1 and 0 < r < 2. Thus, the Ricker''s model has a stable equilibrium N* = K if 0 < r < 2. |
F11. - M-stability (MS) |
F12 -If the factor v affects K |
F13 - random noise |
F14 - variance of log population numbers |
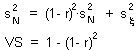
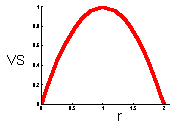
F15 - V-stability (VS) |
F16.- To estimate v-stability in the Ricker''s model we can use the linearized model at the equilibrium point, where N is log population density, and is the white noise with a zero mean. Noise is not correlated with log population numbers. Thus |
|
This graph shows that v-stability equals to zero at r=0 and r=2 (these are the boundaries of quantitative stability). V-stability has a maximum at r = 1. |
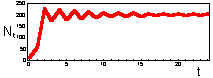
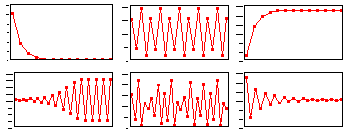
F17: r = 0.5 Monotonous increase in numbers.K=200 |
F17 - r = 1.9 Damping oscillations. K=200 |
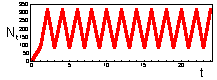
F17: r = 2.3 Limit cycle with period = 2.K=200 |
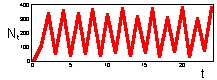
F 17: r = 2.6 Limit cycle with period = 4.K=200 |
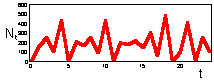
F17: r = 3.0 Chaos. K=200 |
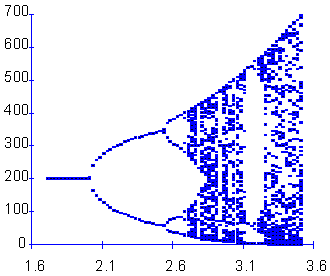
F18 - the bifurcation plot. r < 2 Stable equilibrium, r = 2 Bifurcation into a 2-point limit cycle, r = 2.5 Bifurcation into a 4-point limit cycle, Then there is a series of cycle duplication: 8 points, 16 points, etc., r = 2.692 Chaos ("smear" of points), For r > 2.7 there are some regions where dynamics returns to a limit cycle, e.g., r=3.15. |
F20. |
F 21 |


9.2. Attractors and Their Types
9.3. Equilibrium: Stable or Unstable?
9.4. Quantitative Measures of Stability
9.5. Limit Cycles and Chaos
9.1. Introduction. Main Problems
Some populations have considerable oscillations in their numbers. There are well-known cycles in rodent populations. Many insect pests have regular or irregular outbreaks, e.g., larch budmoth in Switzerland, spruce budworm in Canada, gypsy moth in Europe and in USA.
Example: Gypsy moth population dynamics in Yugoslavia F1
Main Problems:
Ģ To evaluate population stability using models
Ģ To examine effects of different factors on population stability
9.2. Attractors and Their Types
When the dynamics of a population model is traced over a large number of generations, then the model exhibits an asymptotic behavior which is almost independent from initial conditions (e.g., initial population density). Asymptotic trajectory is called "attractor" because model trajectories converge to this asymptotic trajectory.
There may be several attractors in a model. In this case each attractor has a domain of attraction. Model trajectory converges to that attractor in which domain initial conditions were located F2.
Types of attractors:
1. Stable equilibrium (=steady state)
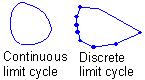
2. Limit cycle
3. Chaos
9.3. Equilibrium: Stable or Unstable?
Equilibrium is a state of a system which does not change.
If the dynamics of a system is described by a differential equation (or a system of differential equations), then equilibria can be estimated by setting a derivative (all derivatives) to zero.
Example: Logistic model F3
An equilibrium is considered stable (for simplicity we will consider asymptotic stability only) if the system always returns to it after small disturbances. If the system moves away from the equilibrium after small disturbances, then the equilibrium is unstable.
The notion of stability can be applied to other types of attractors (limit cycle, chaos), however, the general definition is more complex than for equilibria. Stability is probably the most important notion in science because it refers to what we call "reality". Everything should be stable to be observable. For example, in quantum mechanics, energy levels are those that are stable because unstable levels cannot be observed.
Now, let''s examine stability of 2 equilibria points in the logistic model F4
The second example is the bark beetle model with two stable and two unstable equilibria - F5.
Stability of models with several variables
Detection of stability in these models is not that simple as in one-variable models. Let''s consider a predator-prey model with two variables: (1) density of prey and (2) density of predators. Dynamics of the model is described by the system of 2 differential equations ¢F6.
Eigenvalues are used here to reduce a 2-dimensional problem to a couple of 1-dimensional problem problems. Eigenvalues have the same meaning as the slope of a line in phase plots. Negative real parts of eigenvalues indicate a negative feedback. It is important that ALL eigenvalues have negative real parts. If one eigenvalue has a positive real part then there is a direction in a 2-dimensional space in which the system will not tend to return back to the equilibrium point.
There are 2 types of stable equilibria in a two-dimensional space: knot and focus F7.
There are 3 types of unstable equilibria in a two-dimensional space: knot, focus, and saddle F8.
Stability in discrete-time models
Consider a discrete-time model (a difference equation) with one state variable F9
Continuous-time models with 1 variable never exhibit oscillations. In discrete-time models, oscillations are possible even with 1 variable. What causes oscillations is the delay between time steps. Overcompensation is a result of large time steps. If time steps were smaller, then the system would not jump over the equilibrium but will approach to it gradually.
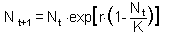
Now we will analyze stability in the Ricker''s model. This model is a discrete-time analog of the logistic model F10. Thus, the Ricker''s model has a stable equilibrium N* = K if 0 < r < 2.
If a discrete time model has more than one state variable, then the analysis is similar to that in continuous-time models. The first step is to find equilibria. The second step is to linearize the model at the equilibrium state, i.e., to estimate the Jacobian matrix. The third step is to estimate eigenvalues of this matrix. The only difference from continuous models is the condition of stability. Discrete-time models are stable (asymptotically stable) if and only if all eigenvalues lie in the circle with the radius = 1 in the complex plain.
9.4. Quantitative Measures of Stability
In the previous section we have discussed qualitative indicators of stability. According to these indicators, a model is either stable if its trajectory converges to an equilibrium state or unstable if it diverges from the equilibrium after small disturbances. However, real populations never converge to an equilibrium because of the random noise associated with weather and other stochastic factors. Thus, qualitative stability has a vague biological meaning. Ecologists are more interested in quantitative indicators of stability which represent the ability of the population to resist environmental fluctuations.
Robert May (1973) suggested to measure system stability by the maximum real part of eigenvalues of the linearized model. It was shown that this value correlates with the variance of population fluctuations in stochastic models.
Sharov (1991, 1992) suggested measures of m- and v-stability that characterize the stability of the mean (m) and variance (v) of population density (initially these measures were called as coefficients of buffering and homeostasis, see Sharov [1985, 1986]). Later they were re-invented by Ives (1995a, 1995b). They can be used to predict the effect of environmental changes (e.g., global warming or pest management) on the mean and variance of population numbers
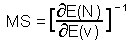
M-stability (MS) was defined as the ratio of the change in mean log population density, N, as a response to the change in mean value of some environmental factor, v ¢F11.
M-stability is the reciprocal of the sensitivity of mean population density to the mean value of factor v. Log-transformation of population density is important because it makes population models closer to linear.
For example, if v is temperature which is going to change by 2 degrees due to global warming, and log population density per ha (log base e) will increase from 1 to 1.5, then the sensitivity is S=(1.5-1)/2=0.25, and m-stability MS=4. The population with higher m-stability will change less than the population with low m-stability under the same changes in average factors.
Strong population regulation increases m-stability because regulating mechanisms will resist to the changes in population density. Let''s assume that regulation is caused by interspecific competition. Then, if conditions become favorable for the population, then the organisms will increase their reproduction rate. However, as population density increases, mortality due to competition increases too and partially compensates increased reproduction rates. If conditions become less favorable, then density will decline and mortality due to competition will decrease and partially compensate the decrease in reproduction rates.
If population dynamics is described by a mathematical model then m-stability can be estimated from that model. The simplest example is the logistic model. Mean population density in the logistic model equals to carrying capacity, K. If the factor v affects K, then ¢ F12. If the factor v affects population growth rate, r, but does not affect carrying capacity, then mean population density will not respond to factor change, and thus, m-stability will be infinitely large.
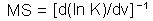
V-stability (VS) was defined as a ratio of the variance of additive random noise (F13) to the variance of log population numbers (F14), we got F15.
Population that has smaller fluctuations of population numbers than another population that experience the same intensity of additive environmental noise has a higher v-stability. To estimate v-stability in the Ricker''s model we can use the linearized model at the equilibrium point F16.
9.5. Limit Cycles and Chaos
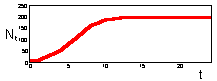
We found that Ricker''s model is stable if 0 < r < 2. The question is what happens to model population when stability is lost. The first suggestion is that population will get extinct. But this is the wrong answer. F 17 there are simulations of population dynamics using Ricker''s model with different values of r.
In the two upper figures the model has a stable equilibrium, only the patterns of approaching the equilibrium are different. In the three lower figures there is no stable equilibrium. Non-equilibrium dynamics may be of 2 types: a limit cycle when the trajectory repeats itself, and chaotic when the trajectory does not repeat itself.
The bifurcation plot helps to visualize all types of dynamics generated by the Ricker''s model. This graph is plotted as follows: for each value of parameter r which is incremented with 0.05 steps, population dynamics was simulated for 200 generations. First 125 generations were discarded because the population may not have reached the asymptotic behavior. Population numbers in the rest 75 generations are plotted versus the value of parameter r ¢F18.
Chaotic dynamics looks like stochastic noise, however the model is absolutely deterministic. Chaotic models are widely used for random number generation in computers.
One of the questions that are often discussed in ecological literature is "does chaos really exists in population dynamics?". The major argument in favor of chaos is: when model parameters are fit to known time series of population dynamics then the dynamics of the model with these parameters is chaotic. Another kind of arguments is based on attempts to separate chaotic dynamics from stochastic noise. However detection of chaos is difficult because of several problems:
Ģ There is no evidence that the model is correct. Usually these models ignore many ecological processes (natural enemies, etc.). It is necessary to use multiple models for detecting chaos (Ellner and Turchin 1995, Amer. Natur. 145: 343-375).
Ģ The confidence interval for parameter values is usually large enough to cover both chaotic and non-chaotic (limit cycle) model dynamics.
Ģ Time series of population dynamics are usually not long enough to separate chaotic dynamics from stochastic noise.
At this point, chaotic dynamics was detected consistently only in a few microtine populations (Ellner and Turchin 1995). I suspect that in these cases chaotic dynamics was induced by the seasonal cycle in population numbers. Chaos was never detected in time series with 1 year as a time step. Probably chaos is a rare phenomenon in population dynamics.
Questions and Assignments to Lecture 9
9.1. Population dynamics is simulated by the differential equation F20. Draw schematically the phase portrait (rate of population growth vs. population density). Find all equilibrium points and characterize their stability.
9.2. Characterize the type of attractor in population dynamics: (a) stable equilibrium; (b) limit cycle, (c) chaos ¢ F21.
Next
Main text
Excel spreadsheet to Stability in discrete-time models