 | Lecture 5. Exponential and Logistic Growth |
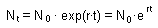
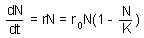
F1.When t is large, then this equation can be approximated by an exponential function |
There are 3 possible model outcomes |
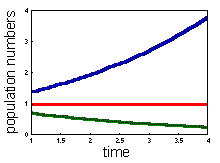
Population exponentially declines (r < 0) , Population exponentially increases (r > 0), Population does not change (r = 0). |
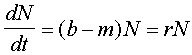
F2, where b is the birth rate and m is the death rate. Birth rate is the number of offspring organisms produced per one existing organism in the population per unit time. Death rate is the probability of dying per one organism. The rate of population growth (r) is equal to birth rate (b) minus death rate (m). |
F3.Logistical model, population density |
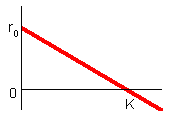
Logistical model, At low densities (N < < 0), the population growth rate is maximal and equals to ro. Parameter ro can be interpreted as population growth rate in the absence of intra-specific competition |
F4 - the differential equation, which has the following solution |
|
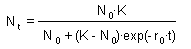
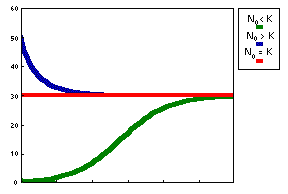
Three possible model outcomes: Population increases and reaches a plateau (No < K). This is the logistic curve; Population decreases and reaches a plateau (No > K) ; Population does not change (No = K or No = 0) |
Discrete-time analogs of the exponential and logistic models: Exponential model analog, where t is time measured in generations, and R is net reproduction rate. For monovoltine organisms (1 generation per year), R is the average number of offsprings per one parent. For example, in monovoltine insects with a 1:1 sex ratio, R = Fecundity/2. The dynamics of this model is similar to the continuous-time exponential model. |
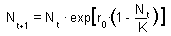
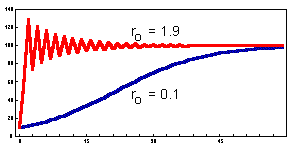
Discrete-time analogs of the exponential and logistic models:Logistic model analog (Ricker). The dynamics of this model is similar to the continuous-time logistic model if population growth rate is small (0 < ro < 0.5). However, if the population growth rate is high, then the model may exhibit more complex dynamics: damping oscillations, cycles, or chaos (see Lecture 9). An example of damping oscillations is shown below |
Complex dynamics results from a time delay in feed-back mechanisms. There are no intermediate steps between time t and time t+1. Thus, overcompensation may occur if the population grows or declines too fast passing the equilibrium point. In the continuous-time logistic model, there is no delay because the rate of population growth is updated continuously. Thus, the population density cannot pass the equilibrium point. |
Addition F5. The Stella model for this modification |
F6. |
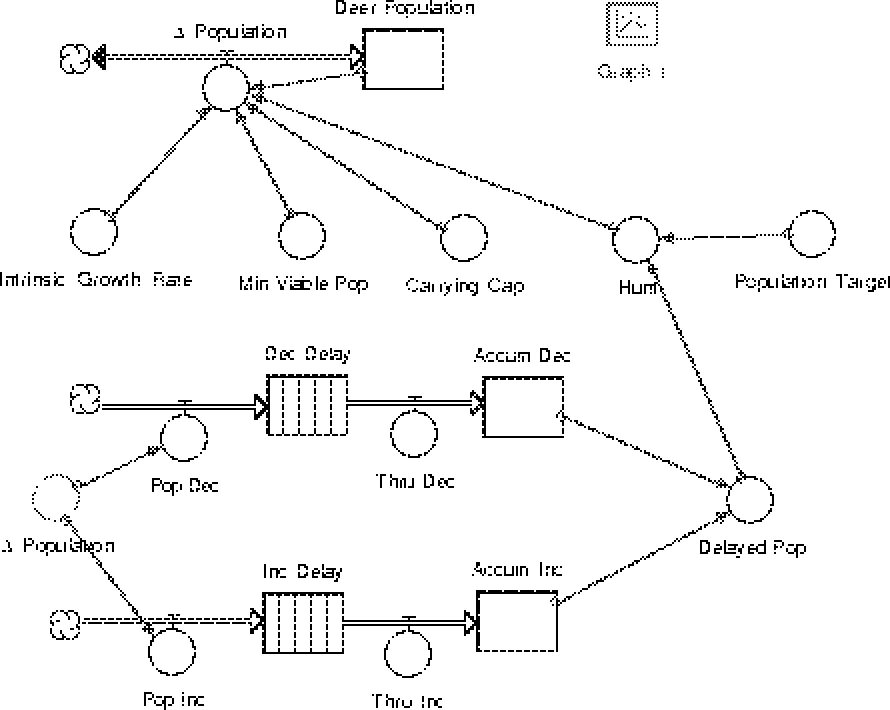
The Stella model whose diagram appears below is a model which incorporates the delay in information gathering about the population. The top part of the model should resemble the model you built in the exercise above. The delta_population valve is a two-directional valve to allow for population increases and decreases. Parameters used to determine this valve''s setting are the instrinsic growth rate (a), the minimum viable population (M), the habitat''s carrying capacity (K) and the annual hunt (H(t)). The hunting level is determined by a method that uses both the population target and a (delayed) estimate of the true herd population. The delayed population is computed in the lower part of the model, which we now consider in detail. The key to this part of the model is to understand that the refusal of conveyors to hold negative quantities (population decreases) necessitates the separate handling of population increases and population decreases. This is the reason for the two separate flows which lead to the delayed population converter. The process begins with delta_population, the same quantity as is held in the valve in the upper part of the model. The delta_population which appears in the bottom part of the picture is a ghost of the valve from the upper part of the model. This "ghosting" allows us easy access to the value of the valve without having to draw long and confusing connectors all over our diagram. The value of delta_population can be either positive or negative, depending on whether the population is increasing or decreasing. If delta_population is positive, the valve Pop_Inc (for population increase) is set to this value. If delta_population is negative, the valve Pop_Dec (for population decrease) is set to the absolute value of delta_population. Whichever valve is not set to a positive number as a result of this process is set to zero. The equations which acheive this are Pop_Inc = max(0,delta_population) These population changes are then placed on the appropriate conveyor belt where they sit for the appropriate length of time, whatever time lag we are modeling. It is important to be certain that both conveyors are using the same time lag. After the appropriate amount of time has passed the material leaves the conveyor belt, passes through the valves Thru_Inc or Thru_Dec (which are automatically set to move exactly the flow which is leaving the conveyor) into a reservoir which holds all the accumulated increases and all the accumulated decreases in population. The difference between the quantity in Accum_Inc and Accum_Dec gives the total population change during the course of the model''s run (except for the most recent changes still in the conveyors). The trick is to convert the accumulated population change information to population data itself. To accomplish this we set the initial value of Accum_Dec to zero while we set the initial value of Accum_Inc to be the initial population of deer as found in Deer_Population. With these initial values set (the initial values of the conveyors are all set to zero) the sum of Accum_Inc and Accum_Dec will of the total population, delayed by the lag time specified in the conveyors. You can plot both Deer_Population and Delayed_Pop on the same graph to convince yourself of this. Now that we have a way of accessing the population as observed at some time in the past, we can investigate several possible hunting quota rules. |


Self-reproduction is the main feature of all living organisms. This is what distinguishes them from non-living things. Any model of population dynamics include reproduction. We will discuss two most important models of population growth based on reproduction of organisms: exponential and logistic models.
Exponential and logistic models help to solve different kinds of problems in ecology, here are some examples:
How long will it take for a population to grow to a specific size?
What will be population size after n years (or generations)?
How long the population can survive at non-favorable conditions?
5.1 Exponential model
5.2. Logistic model
5.3. Discrete-time analogs of the exponential and logistic models.
Exponential model is associated with the name of Thomas Robert Malthus (1766-1834) who first realized that any species can potentially increase in numbers according to a geometric series. For example, if a species has non-overlapping populations (e.g., annual plants), and each organism produces R offspring, then, population numbers N in generations t=0,1,2,... is equal to F1.
Parameter r is called:
Malthusian parameter
Intrinsic rate of increase
Instantaneous rate of natural increase
Population growth rate
"Instantaneous rate of natural increase" and "Population growth rate" are generic terms because they do not imply any relationship to population density. It is better to use the term "Intrinsic rate of increase" for parameter r in the logistic model rather than in the exponential model because in the logistic model, r equals to the population growth rate at very low density (no environmental resistance).
Assumptions of Exponential Model:
Continuous reproduction (e.g., no seasonality)
All organisms are identical (e.g., no age structure)
Environment is constant in space and time (e.g., resources are unlimited)
However, exponential model is robust; it gives reasonable precision even if these conditions do not met. Organisms may differ in their age, survival, and mortality. But the population consists of a large number of organisms, and thus their birth and death rates are averaged.
Parameter r in the exponential model can be interpreted as a difference between the birth (reproduction) rate and the death rate F2.
Applications of the exponential model
microbiology (growth of bacteria),
conservation biology (restoration of disturbed populations),
insect rearing (prediction of yield),
plant or insect quarantine (population growth of introduced species),
fishery (prediction of fish dynamics).
Logistic Model
Logistic Model
Logistic model was developed by Belgian mathematician Pierre Verhulst (1838) who suggested that the rate of population increase may be limited, i.e., it may depend on population density F3.
At low densities (N < < 0), the population growth rate is maximal and equals to ro. Parameter ro can be interpreted as population growth rate in the absence of intra-specific competition.
Population growth rate declines with population numbers, N, and reaches 0 when N = K. Parameter K is the upper limit of population growth and it is called carrying capacity. It is usually interpreted as the amount of resources expressed in the number of organisms that can be supported by these resources. If population numbers exceed K, then population growth rate becomes negative and population numbers decline. The dynamics of the population is described by the differential equation F4.
Logistic model has two equilibria: N = 0 and N = K. The first equilibrium is unstable because any small deviation from this equilibrium will lead to population growth. The second equilibrium is stable because after small disturbance the population returns to this equilibrium state.
Logistic model combines two ecological processes: reproduction and competition. Both processes depend on population numbers (or density). The rate of both processes corresponds to the mass-action law with coefficients: ro for reproduction and ro/K for competition.
Interpretation of parameters of the logistic model
Parameter ro is relatively easy to interpret: this is the maximum possible rate of population growth which is the net effect of reproduction and mortality (excluding density-dependent mortality). Slowly reproducing organisms (elephants) have low ro and rapidly reproducing organisms (majority of pest insects) have high ro. The problem with the logistic model is that parameter ro controls not only population growth rate, but population decline rate (at N > K) as well. Here biological sense becomes not clear. It is not obvious that organisms with a low reproduction rate should die at the same slow rate. If reproduction is slow and mortality is fast, then the logistic model will not work.
Parameter K has biological meaning for populations with a strong interaction among individuals that controls their reproduction. For example, rodents have social structure that controls reproduction, birds have territoriality, plants compete for space and light. However, parameter K has no clear meaning for organisms whose population dynamics is determined by the balance of reproduction and mortality processes (e.g., most insect populations). In this case the equilibrium population density does not necessary correspond to the amount of resources; thus, the term "carrying capacity" becomes confusing. For example, equilibrium density may depend on mortality caused by natural enemies.
Questions and assignments to Lecture 5
Population numbers of cockroaches double every month (30 d). What is their intrinsic rate of increase (per day)?
What is the intrinsic rate of increase in a human population if every family has 3 children at parent''s age of 30 (there are no singles, no divorces, sex ratio 1:1)? What would be the numbers of human population after 100 years if initial numbers are 4 billion?
A new lake was created after building a dam. The number of fish censused after 2, 4, 6, 8 and 10 years since that time was 1000, 2000, 3500, 5000 and 6000. Estimate parameters of the logistic model using non-linear regression. Plot the data and the model on one graph.
Use Excel to simulate population dynamics with the discrete-time logistic model (Ricker''s model) for 60 generations. Use K=100; r = 0.1, 0.5, 1.0, 1.5, 1.9, 2.2; No = 10.
Addition: Setting Hunting Quotas--Modified Logistic Model
Review of the Logistic Model
The logistic model is useful in describing populations which exhibit exponential growth at small populations but who live in environments which enforce an upper limit on population size. The logistic population is usually written:
P(t+1)=P(t)+aP(t)(1-P(t)/K)
where a is the intrinsic growth rate (the exponential growth rate at low population levels) and K is the carrying capacity of the habitat under consideration.
With this model populations move toward the carrying capacity K as time goes on regardless of the initial population. Even a very tiny population will eventually reach the carrying capacity. Extinction never occurs under the logistic model.
Introducing a Hunting Factor
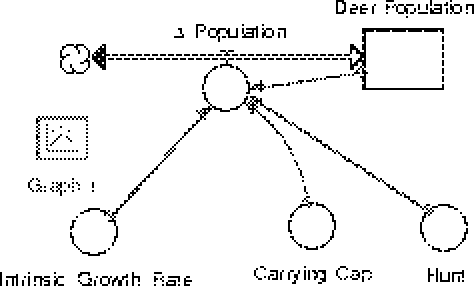
If the population we are studying is a population of game animals, it is important to include the effect of hunting in the model. Having a model of this sort can help wildlife managers set scientifically sound hunting limits. If H is the number of animals taken by hunters each time period (usually years) then the logistic model can be modified to account for this by subtracting H from the population each time period. The resulting model is:
P(t+1)=P(t)+aP(t)(1-P(t)/K)-H
The Stella model for this modification could look like F5.
Exercises
The exercises below assume a Stella model has been built with an intrinsic growth rate a of 10 percent and a carrying capacity K of 1000.
If the annual hunting level is 40 animals, what is the long term population of the hunted species?
If the annual hunting level is 49 animals, what is the long term population of the hunted species?
If the annual hunting level is 51 animals, what is the long term population of the hunted species?
If the annual hunting level is 60 animals, what is the long term population of the hunted species?
These exercises are designed to show that even a very small change in the level of hunting can have a dramatic effect in the long term health of the population. Maintaining hunting levels near the maximum permissible without extinction can lead to extinction if a random detrimental event (cold winter, drought, etc.) occurs.
Question
How would you incorporate the possibility of a random detrimental event into your Stella models?
A Second Logistic Modification
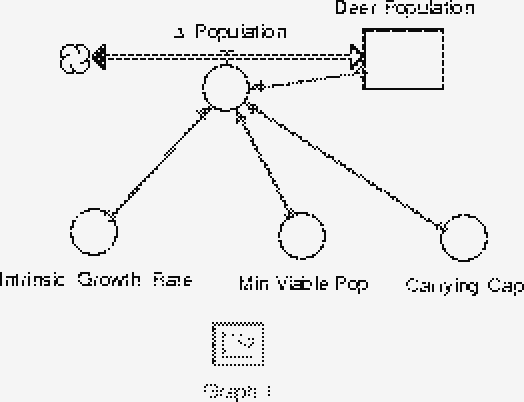
If we leave behind the idea of hunting for the time being, there is a second modification to the logistic model which increases the model''s realism and usefulness. This is the addition of the ecological idea of a minimum viable population. The idea here is that a population of any species has a minimum level at which the population can thrive. If the population drops below this minimum level various environmental and genetic factors lead to the elimination of the population. The relevant factors might include inability to find mates, loss of genetic diversity and increased vulnerability to short and long term environmental changes and disease events.
The logistic model can be modified to account for the existence of a minimum viable population. One way of doing this is to use the difference equation:
P(t+1)=P(t)+aP(t)(P(t)/M-1)(1-P(t)/K)
where a and K have the same meanings as before. M is the minimum viable population. A Stella model of this situation might look like F6.
Exercises
Build a Stella model incorporating the idea of minimum viable population and verify that the model behaves in the expected way; that populations less than M decrease to oblivion, that populations between M and K increase to the carrying capacity and populations starting at levels greater than K decrease to K over time.
Build a Stella model incorporating both minimum viable populations and hunting. Does the existence of a minimum viable population effect the allowable hunting level? If so, does this alloweable level increase or decrease?
Time Delays
So far we have not introduced any new Stella capabilities. In this section we struggle with a new and very powerful idea, the ability of Stella to incorporate time delays in its modeling. The key to this ability is the form of reservoir known as a conveyor.
Conveyors always occur in concert with an outgoing valve. The outgoing valve cannot take a formula, it is always open to whatever level of material is leaving the conveyor.
Conveyors work by accepting flows into the conveyor and then holding it there for a specified length of time. When the time is up the material is disgorged from the conveyor into its outgoing valve which carries it away from the conveyor. The time delay for a given conveyor is fixed for an entire run of the model, but different conveyors can have different delays.
One important limitation of conveyors is that they only hold positive amounts of flow (as near as I can tell.) It is still possible to delay decreases in quantities, but it requires some obscure messing around with the model to accomplish.
Time delays are important to real world modeling because often decisions are made based on historical information. Any changes in hunting levels, for example, would be based on population estimates made well before the hunting season actually begins. Both the delay in taking a census and the lag time between the determination of hunting levels and the actual hunt begins lead to time delays in the hunting model.
As an example, suppose we wanted to model a quota setting algorithm as well as the population of deer in a certain part of Minnesota. We might start with a modified logistic model incorporating both hunting and minimum viable populations. Instead of having a fixed hunting level, however, we might want to incorporate a specific method for determining the hunting quota every year. Such a technique might be implemented by a large bureaucracy to simplify and depoliticize the annual determination of bag limits.
One possible decision making model would be to determine a population target T for the deer herd under study. It might then be reasonable to set the hunting quota to be the difference between the deer population and the target T. If we let H(t) denote the hunting quota during year T, then this scheme is equivalent to setting
H(t)=P(t)-T.
Recall that P(t) is the deer population at time t.
Exercise
Build a Stella model which implements this idea. (You won''t need conveyors, yet.) Does it work? Is the target population achieved in the long run? What happens if the target population is set too low? How does your model handle the situation where H(t) is negative?
In the real world we do not know the population P(t) at the exact time we need it to determine the hunting quota H(t). There is always a delay in processing and distributing field information. In addition, the quota must be set long before the hunting season begins, perhaps years ahead of time. It is important to be able to model this delay because it has serious implications for the long term behavior of populations.
Control Theory
This model concerns itself with trying to keep a system at a specified level. In our case the quantity being controlled is the deer population. The control itself is achieved through the process is setting hunting quotas based on deer population. This concept of controlling a system based on ongoing observations about the system is called dynamical systems control. The theory of such system manipulations is called control theory, a subfield of classical applied mathematics. The problems in this discipline are both important and hard.
The goal of this model is to demonstrate the complexities introduced by time lags in just about any evolving system. The idea of controlling a system is also introduced in a way which, I hope, demonstrates some of the subtle challenges to trying to control a complicated situation. Perhaps some students will begin to appreciate the difficult decisions policy makers must make in the area of natural resources management and other arenas. Lastly, perhaps the idea of control theory will motivate a student of mathematics to continue his or her studies with a renewed sense of purpose