 | Regressions and Modelling |
2. The mean population density, M, is estimated as a weighted mean of mean densities, Mi, in each stratum, i, with weights, wi equal to the area covered by stratum i: |
3. The standard error, SE, of the mean is equal to it, where SEi is the standard error for the mean in stratum i |
The proportion of recaptured organisms is assumed to be the same as the proportion of marked organisms. Population size can be found as: N = nM/m (the Lincoln Index). |
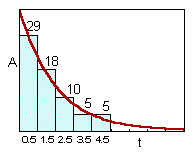
Removal method. population numbers and the number of captured individuals declines exponentially.The model of removal: dN/dt = -aN, where a is the removal rate. |
Removal method. Pielou (p. 127) used a different method for estimating parameters which is based on the analysis of 2 first time intervals only. For example, if captures in the first 2 time intervals were 29 and 18 animals. This model can be generalized assuming the recruitment of organisms (e.g., emergence of adult insects from the soil). |
Indirect methods (relative estimates). The residual sum of squares |
The Least Square Method means that we find such parameter values a and b that the value of is minimized. It follows from the calculus that derivatives at the minimum point are equal to zero: |
After substituting of and simplification |
The total sum of squares |
The sum of squares for the factor effect |
where the covariance is estimated using equation |
The residual sum of squares |
R-square for indirect method |
Regression analysis. Significance. R = 0.82, N.S.! However, significance does not mean biological significance (e.g., if R = 0.01) |
Regression analysis. Influence diagnostics. It is important to check if the most influential points are correct |
Regression analysis. Outliers. Possible solutions: 1. Ignore an outlier, 2. Change regression model, 3. leave it as it is |
Regression analysis. Non-linearity. Plot data before any regression analysis. Use polynomial or non-linear regression if the relationship is not linear |
Regression analysis. Variable transformation. Use transformations only if they are biologically meaningful. It is better to use non-linear models. |
Polynomial regression. This is a non-linear function, but least square estimation leads to a system of linear equations. Thus, this regression is analyzed by a linear method. This is NOT a non-linear regression! |
Note: use step-wise regression when you test the significance of non-linear terms in the polynom. The effect is significant if the increment of R-square is large enough according to F-statistics (see Table of F-statistics), ,where, in the numerator, there is a difference in R-squares estimated in two consecutive steps,v1 and v2 are corresponding degrees of freedom (d.f.= number of regression coefficients minus 1). The difference v1-v2 is equal to 1 because one term is added at a time. |
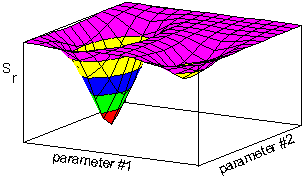
Nonlinear regression is estimated numerically. Residual sum of squares is a function of model parameters. Thus the minimum can be found as a lowest point on the response hyper-surface. |
the poisson distribution, where M is the mean number of individuals per plant. It is clear that the mean density, M, can be estimated as the negative logarithm from the proportion of infested plants, po. |
the negative binomial distribution, where k is the aggregation parameter. To test, which model is better, it is necessary to use the non-linear regression and then to compare R-square. |
Exam: The weed is more abundant at the edges of the field. Weed biomass is sampled at random locations within the field. Can we use this equation, to estimate the standard error of mean weed biomass per sq.m.? If not, then what options do we have? |
Exam. Solve the ordinary kriging system for two sample points. z are variable values at sample points; estimate z-value at the estimation point. |
2.4. Stratified sampling
Stratified sampling is used if sampled area (or volume) is heterogeneous (Pielou, p.107). If patch size is much larger than inter-sample distance, then kriging can be used instead of stratified sampling.
In stratified sampling program, the area (volume) is subdivided into 2 or more portions which are sampled separately. Example: pine sawflies prefer to spin their cocoons close to the tree; thus, the area adjacent to trees (within 1 m radius) can be sampled separately from the rest of the area.
1. Density of samples in each stratum should be proportional to the variance of organism counts in the stratum -- in this case the maximum precision is reached. Taylor''s power law can be used to predict variance from the mean. Variance usually increases with mean, and thus, the stratum with higher organism density should be sampled more intensively.
2. The mean population density, M, is estimated as a weighted mean of mean densities.
2.6. Capture-recapture and Removal Methods
Capture-Recapture Method
Suppose the population is of size N, so that N in the number we wish to estimate. Suppose, M organisms were captured, marked (or tagged) and released back into the population. After some time that should be sufficient for organisms to mix, n organisms were captured, and m of these appeared to be were marked. The proportion of recaptured organisms is assumed to be the same as the proportion of marked organisms.
The following conditions should be met:
No immigration, emigration, births or deaths between the release and recapture times.
The probabilities of being caught are equal for all individuals (including marked ones).
Marks (or tags) are not lost and are always recognizable.
The first two conditions are often non-realistic, and thus, several modifications of this method has been developed that loosen these conditions. Perhaps the most popular is the Jolly-Seber method which requires capturing and marking of animals at regular time intervals. Animals, marked and released each time, should have different marks so that it is possible to distinguish between individuals marked on different dates. Algorithm is given in Southwood (1978).
Jolly-Seber method gives an estimate of population size on each specific date; the first condition can be violated. However, the second condition is still required. It is also possible to estimate mortality+emigration rate and birth+immigration rate on each specific day. These rates are assumed to be constent for all individuals (including marked individuals).
There are numerous other models for capture-recapture experiments, which are specific for a particular population. For example, age structure of the population may be important, or some individuals may have higher probability to be caught than others.
Another problem arises if the population has no boundaries. In this case, a grid of traps can be established, and only the central portion of the grid is used for analysis (because traps near the edges may be influenced by migration). The area covered by the grid should be much larger than the average distance of animal dispersal.
Because the biology of different species is variable, it may be necessary to modify the capture-recapture model.
Removal method
Removal method is based on intensive trapping of animals in an isolated area. Migration is prevented by some kind of barriers. It is assumed that there are no births or natural deaths of organisms. The proportion of animals captured each day is the same. Therefore, population numbers and the number of captured individuals declines exponentially.
The model of removal: dN/dt = -aN, where a is the removal rate.
The solutionof this differential equation is N = Noexp(-at), where No are initial numbers.
Then the number of animals captured per unit time is equal to A(t) = aNoexp(-at) Parameters a and No can be estimated using the non-linear regression.
Prerequisites include statistics (or biometry), and general ecology. The students should be familiar with descriptive statistics, confidence intervals, linear and non-linear regression analysis. From elementary calculus (it is a pre-requisite for statistics) students should know matrix operations and differential equations. From principles of ecology, it is necessary to know the types of interactions between organisms, trophic levels. Besides that, an experience with personal computers is required (PC or MAC): word processing, graphics software.
2.7. Indirect methods (relative estimates)
These are many measures which may correlate with population density: trap catches, visual counts, counts of animal products (frass, nests), proportion of infested hosts (for parasites, in broad sense). Indirect measures can be related to population density using regression analysis (linear or non-linear).
Let us remember the basic concepts of regression analysis.
Linear regression:
y'' = a + bx
The least square method is most often used to draw the "best" line through a cloud of points. This method adjusts the values of regression parameters (a and b) so that the residual sum of squares (=sum of square deviations of points from the line) reaches a minimum.
The residual sum of squares is Sr (see picture)
The Least Square Method means that we find such parameter values a and b that the value of is minimized (see pictures).
Important things in regression analysis: Significance, Influence diagnistics, Outliers, Non-linearity, Variable transformation.
Polynomial regression
Nonlinear regression
Several methods are used to search for a minimum. Examples are:
simplex - slow but more reliable
gradient - faster but not robust
Danger: you can end up in a local minimum (see the figure above). To avoid it, try to start from various initial conditions.
It is desirable that the equation represents some theoretical model of a real system. Then regression coefficients have biological interpretation.
Example. We return back to indirect population measures. Binomial sampling is a method when instead of counting organisms in each sample, we count the number of samples where organisms were present. For example, the density of Colorado potato beetles can be reconstructed from the proportion of potato plants where at least one insect was found. This is a faster method than counting all insects. If we assume the random (poisson) distribution of beetles, then the proportion of infested plants is equal to the zero term po of the poisson distribution (see picture)
An alternative theoretical model can be derived from the assumption that beetles are aggregated on host plants and that their distribution is negative binomial. The zero term of the negative binomial distribution.
Random distribution - http://home.comcast.net/~sharov/PopEcol/lec3/random.html
To test, which model is better, it is necessary to use the non-linear regression and then to compare R-square.
Main text - http://home.comcast.net/~sharov/PopEcol/lec2/indirect.html
Next: Spatial distribution of organisms
Table of F-statistics P=0.05
Table of F-statistics P=0.01
Table of t-statistics
Table of Chi-square statistics


