 | Development of poikilothermous organisms, degree-days |
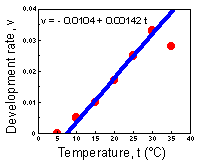
F1. In the temperature range from 10 to 30 (░C), development rate changes almost linearly with increasing temperature. At very low temperature there is no development, and at very high temperature development is retarded. |
F2 |
F3 |
This equation shows that degree-days do not depend on temperature! This is the principal feature of the degree-day model. In our case, S = 1 / 0.00142 = 704 degree ū day. The units of degree-days are degrees (centigrade) multiplied by days. Some times, it is better to use degree-hours if development is very fast |
F4 |
|
F5 - Light-blue area equals to accumulated degree-days. Here the average temperature is below tmin but organisms can accumulate some degree-days because daily maximums are above tmin |
F6 - Light-blue area again equals to accumulated degree-days. Daily maximum temperature exceeds tmax however this excess does not count in the accumulation of degree-days. |
F7 |
F8 |
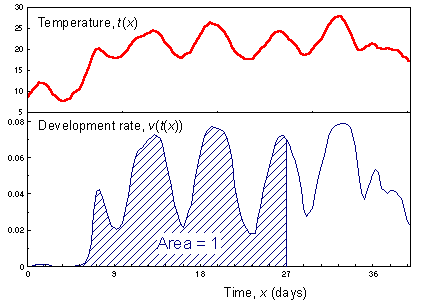
F9 - where v(t) is the rate of development as a function of temperature, t; t(x) is temperature as a function of time, x; and T is the development time. If temperature is defined as a function of time (see the graph below), then at each time the rate of development is estimated as a non-linear function of time. Finally the integral of function v(t(x)) (the area under the curve) from 0 to T should be equal to 1. |
The discrete-time version of the previous equation is: |
|
F10 - Progress in physiological age in one time step may depend on temperature (3 arrows at the left side of this graph). |
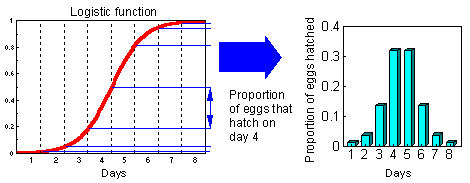
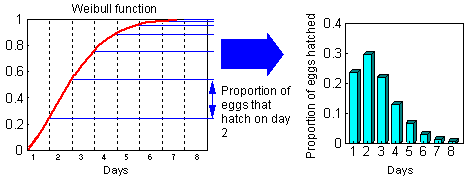
F11- Two graphs below show how to convert cumulative probability function of egg hatch time into the proportion of eggs that hatch each day (logistic and Weibull distributions) |
|
|
L8. Development of poikilothermous organisms, degree-days
Rate of development
8.2 Simple degree-day model
8.3 How to measure temperature?
8.4 Improved degree-day model
8.5 Other non-linear models of development
8.6 Physiological time
8.7 How to combine physiological time with the model of Leslie?
8.1. Rate of development
Homeothermous organisms are warm blooded (mammals, birds)
Poikilothermous organisms are cold blooded (all invertebrates, plants, fishes, amphibians, reptiles)
Development of poikilothermous organisms depends on temperature, whereas development of homeothermous organisms is temperature-independent.
The rate of development can be measured by a reciprocal of the number of time units (e.g., days) that is required for completion of development. Rates of development can be estimated for the entire onthogenesis or for a specific stage. For example, if it takes 15 days for an insect to develop from egg hatch till pupation, then the rate of larval development is v = 1/15 = 0.0667.
Temperature (░C), t Development time,
T Development rate,
v = 1 / T
5 - -
10 200 0.005
15 100 0.010
20 60 0.017
25 40 0.025
30 30 0.033
35 35 0.028
Here is the graph of development rate versus temperature F1.
8.2. Simple degree-day model
Degree-day model is based on the assumption that development rate is a linear function of temperature.
In most cases, real development rate is indeed a linear function in the region of moderate temperatures (15-25░) (see figure above). Deviating points at temperatures that are too low or too high can be ignored. For example, in the figure, regression line is plotted for points from 10 to 30░. At 5░ all organisms died and there was no development. At 35░ organisms were overheated and development rate of survivors was reduced. If we are interested in simulating organism development in moderate temperatures, then the degree-day model will be the best choice.
Terms:
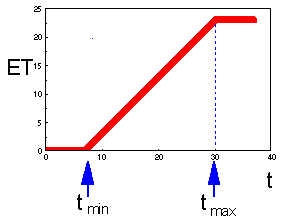
tmin is the lower temperature limit; this is the temperature at which development rate reaches zero.
ET = t - tmin is effective temperature.
S are degree-days; this is the effective temperature multiplied by the number of days required to complete development.
Lower temperature limit and degree-days can be estimated from the regression line of development rate versus temperature. We assume that regression equation is:
v = a + bt
where a is intercept, and b slope.
a + btmin = 0, by the definition of the lower temperature limit. Thus F2.
In our case, tmin = 0.0104 / 0.00142 = 7.3░.
Duration of development is T = 1/v. Thus, degree-days can be estimated as F3.
Because degree-days are temperature-independent, it is possible to use them to predict development time in experiments with variable temperature. In this case effective temperatures are accumulated day by day, and when the sum reaches S, then development is finished.
Example: tmin = 10 , S = 100.
Day No. Average
Temperature t Effective temperature,
t - tmin Accumulated
degree-days
1 15 5 5
2 18 8 13
3 25 15 28
4 23 13 41
5 24 14 55
6 18 8 63
7 17 7 70
8 15 5 75
9 18 8 83
10 15 5 88
11 22 12 100
12 25 15 115
Accumulated degree-days reach the value S = 100 on day 11. Thus, it takes 11 days to complete the development.
8.3. How to measure temperature?
Yes, use a thermometer! The only problem is when and where to measure it. The simplest way is to measure minimum and maximum temperatures each day and then take the average. Majority of weather data bases contain minimum and maximum temperatures. More accurate estimates can be obtained if temperature was measured several times a day at regular intervals (e.g. every 3 h). Then, you can average these measures.
The next problem is where to measure. It is obvious, that temperature should be measured where studied organisms are located. For example, if we study development of soil insects [e.g., wireworms (Elateridae)], then temperature should be measured in the soil at ca. 5-10 cm from the surface. Spider mites live on the lower leaf surface where temperature is several degrees lower than the ambient temperature. In this case, temperature should be measured under the leaf. Some times it is possible to build a regression model that predicts the temperature in a specific niche from ambient temperature recorded at weather stations.
Can we average temperature prior to analysis?
If development rate is a linear function of temperature, then temperature can be averaged prior to analysis. However, if this function is non-linear (e.g., in the improved degree-day model, see below), then temperature averaging may result in substantial errors.
8.4. Improved degree-day model
The purpose of modification is to use the model for a wide range of temperatures. Effective temperature (ET) is defined as follows F4.
This model is non-linear because the graph is not straight (see the figure above). Thus, temperature cannot be averaged! In particular, you cannot use average daily temperature. Instead, it is necessary to use actual temperature dynamics. Accumulated degree-days are equal to the area under the temperature curve restricted to the temperature interval between tmin and tmax - F5
Another example ¢ F6
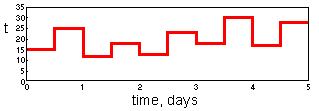
Non-linear models of development rate require simulation of diurnal temperature change. In most cases, only daily minimum and maximum temperature are known. There are two most frequently used methods for simulation temperature change. "Rectangular" model assumes that temperature stays at maximum for half of the day and stays at minimum for the other half ¢ F7
This method is not very accurate but it is simple and fast.
"Sine-wave" method was developed by Allen (1976; Environ. Entomol. 5: 338-396). This model generates smooth temperature changes as in the second figure above.
8.5. Other non-linear models of development
Other non-linear models of development
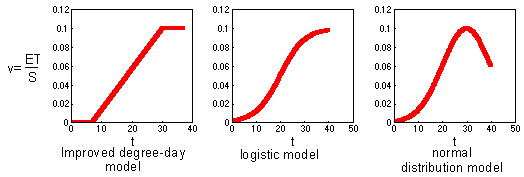
Improved degree-day model inherited a linear relationship between development rate and temperature (between two temperature limits tmin and tmax) from the simple degree-day model. Now it is time to make the next logical step: not to use linear relationships at all. Below two alternative models are shown: the logistic model and the normal distribution- F8
Non-linear models like the logistic model or the normal distribution are easy to interpret for experiments with constant temperature. In this case, development rate can be defined as a reciprocal of development time (v = 1/T). But what is development rate if temperature changes? We cannot accumulate degree-days any more because the model is non-linear. In attempt to answer this question a new concept has been developed: a concept of physiological time.
8.6. Physiological time
What is time? This is the most fundamental question in science. It attracted the best brains in human history from St. Augustin to Einstein. What is the relationship between time and dynamics? Do we measure dynamics relative to time, or may be time should be measured with dynamics? Newtonian physics considered absolute and universal time which was above nature. Alternative point of view is that each system has its own individual time measured by the number of events. For example, time in human life can be measured by the number of decisions made. A person who lives passively, and avoids making decisions, remains a child psychologically even if he is biologically an adult. Further discussion on the problem of biological time can be found in the paper of Sharov (1995).
We can apply the concept of biological time to the development of poikilothermous organisms. The progress in organism''s development can be viewed as a biological clock that measures physiological time. Physiological time goes fast when it is warm and slow when it is cold. Then, development rate can be defined as advance of physiological time per unit of calendar time. For example, if development rate of insect larvae is 0.07 per day then, taking the entire physiological time at larval stage as 100%, in one day the insect will increment its physiological time by 7%.
To determine the duration of development we will accumulate development rates rather than effective temperatures. Development completes on the day when accumulated development rates reach 1 (=100%), i.e., the following equation is true F9
How to measure physiological time?
There is no mechanical watch that measures physiological time. Also there are no hour and minute hands inside an organism. However, in some cases it is possible to find indicators of physiological time, e.g., concentration of hormones and metabolites, CO2 emission rate, etc. However, these indicators are usually not very accurate. For example, the respiration rate is high in gypsy moth eggs for ca. 2 weeks after oviposition; then it decreases and stay at low level. Thus, it is possible to distinguish between these two periods of egg development.
The problem of measurement can be evaded by preparing organisms of specific physiological age for the experiment. This is analogues to quantum mechanics where it is impossible to measure exact location of an electron without changing its momentum. But it is possible to prepare electrons with specific characteristics. To prepare organisms in a specific physiological age, we need to keep them in standard conditions for a specific time. For example, if the duration of insect pupal stage is 10 days in 25░, then after 5 days in this temperature, pupae will be in the middle of their pupal stage.
What are the advantages of physiological time concept?
As compared to the degree-day model, the concept of physiological time has the following advantages:
It makes no arbitrarily assumptions on the shape of development rate function. This function can be linear, logistic, normal distribution, etc.
It admits the effect of other factors besides temperature on the rate of development. The rate of development may depend on food quality and quantity, photoperiod, and other factors.
Before the concept of physiological time was developed there were attempts to incorporate the effect of factors other than temperature into the degree-day model. It was assumed that additional factors change the amount of degree-days required to complete development. For example, gypsy moth larvae develop faster on preferred tree species (oaks) as compared to non-preferred species (e.g., maples). It was assumed that more degree days should be accumulated by gypsy moth larvae on maple than on oak trees to pupate. This model does not work if larval migration is considered among trees because degree-days accumulated on different tree species are not comparable. For example, if larvae move from an oak tree to a maple tree, they become "younger". If they were ready to pupate on oak before migration, then after migration to maples they still have to accumulate additional degree-days to pupate.
8.7. How to combine physiological time with the model of Leslie?
The model of Leslie can be easily modified to incorporate physiological time. In the original model age and time were equivalent because each time step organisms were moving to the next age class. Now age will be measured in units of physiological time! Each column and row in the matrix corresponds to a specific physiological age f10
Also, individual variation in development rate (distributed delays) can be taken into account (branching arrow at the right side of the graph).
At the start of simulation all organisms can be placed into the first age class. Another option is to add variability in the starting date of development. For example, if we simulate insect larval development, it is unrealistic to assume synchronous egg hatch in one day. It is better to assume distributed egg hatch time. Three kinds of distributions are used most often: normal, logistic, and Weibul.
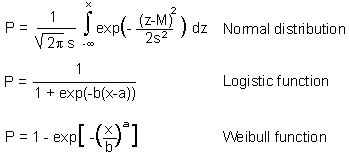
Cumulative distributions are described by equations F11
Normal and logistic distributions are both symmetrical and are very similar. But Weibull distribution is asymmetrical. Actual distribution of egg hatch time is often asymmetrical, and thus, the Weibul distribution is usually better than the normal and logistic distributions
8.8. Questions and Assignments to Lecture 8.
8.1 Insect development rate. Development of pea weevil (Bruchus pisorum) eggs was studied in the laboratory at constant temperatures (Smith, A.M. 1992. Environ. Entomol. 21:314-321):
Temperature, C Egg development time, days
10.7 38.0
14.4 19.5
16.2 15.6
18.1 9.6
21.4 9.5
23.7 7.3
24.7 4.5
26.9 4.5
28.6 7.1
Plot development rate vs. temperature (use Excel)
Use linear regression to estimate lower temperature threshold and degree days required for egg development.
Average temperature in a sequence of days was: 15 20 25 20 15 10 15 10 15 20 15 20 15 10 15 20 25 20 15 20
When do you expect eggs to hatch if they were laid on the first day? (Note: ignore diurnal temperature change).
