 | Symbology and Details about Layer Properties |
Symbol Gallery |
Transperency slider |
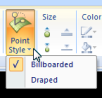
Point Style: the point style menu gives you the option of displaying the point symbol as a billboarded 3D symbol when the map is in 3D displaymode, or as a rasterized symbol draped on the surface of the map |
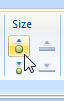
Size |
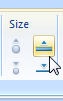
A similar pair of controls is available for changing the width of lines or the outlines of fill symbols |
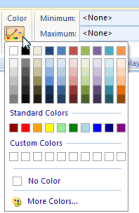
Line Color: you can change the color of a line symbol or the outline of a polygon symbol by clicking the Line Color control to display a selection of standard palette of colors and variations on those colors |
|
|
|
|
|
Googlezed |
|
Label Manager |
Annotation |
Graphic Text |
When you add content to ArcGIS Explorer, the way itÆs displayed on the map is often defined by the source of the content. For example the control that creates a note will assign a symbol to that note, KML layers define how their features are drawn, and ArcGIS layers'' symbology have been defined by their authors.
In some cases, youÆll decide how the GIS information that you add to the map should be displayed, whether itÆs to assign a symbol to a place that you find, or to specify how the features in a shapefile should be drawn.
When you add content to the map (i.e. create a note, add a shapefile, etc), the application assigns a default symbol for you to display the data. You can change the symbol used by clicking the itemÆs Appearance tab.
The Appearance tab includes a Symbol group that contains various controls for selecting symbols to draw the GIS data with and controls for modifying properties of the symbol. Notice the different galleries for points, line, and areas (polygons):
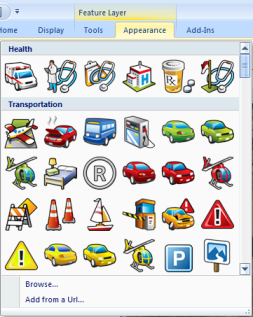
The Symbol Gallery
The Symbol Gallery displays the list of symbols available for the type of GIS feature that you are symbolizing (i.e. point, line or polygon). You can scroll through the symbols or drop the gallery down to see more symbols. When you click a symbol, that symbol is assigned and the map updates to display it.
When displaying point symbols, you can click the Browseģ or Add from a Url... button to specify a local file name or Url to use as the source of the point symbol. Symbols specified in this way will be added to a group named My Symbols and remain a part of your Symbol Gallery.
Changing the symbol properties
Once you choose a symbol, you use the other controls in the symbol to change some characteristics of how itÆs displayed. Note that the controls are specific to the geometry of the symbol; in other words, some controls only display when you''ve selected points or lines or polygons.
Transparency: clicking the transparency control displays a slider control that allows you to change how transparent the symbol displaying the data is. The more transparent, the more you can see the map content that is drawn under the symbolized data. The transparency control is available for all geometry types in feature layers: point, lines, and polygons
Size: when you add points to a map, a symbol size is assigned for you based on the scale ranges the data is displayed in, what the data represents (that is, a map note versus a GIS feature), etc. In ArcGIS Explorer this point size is represented in terms of pixels or a point to map units conversion. In most cases, you just want to adjust the symbol to be a little larger or smaller. Two controls, one to increase, the other to decrease the point size, are available in the Appearance tab''s Symbol group
Problem: You have encountered or created some really nice symbols and want to stash them away for future use.
Sometimes it takes forever to get a symbol just right. And sometimes youÆre looking at a map or layer file made by someone else and just love what theyÆve done. In either case, it is not necessary to repeat the work, because you can save symbology definitions in a couple different ways.
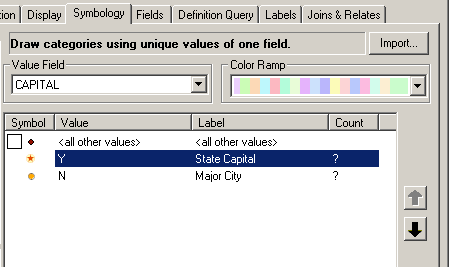
The ESRI Streetmap package comes with a layer file that can be used to produce pretty maps from the data. In particular, I like the orange star symbol they use for state capitals
In order to save it for re-use, I would follow the steps below. These same steps also can be used to save line symbols, fill symbols (for polygons), and font definitions (for text labels).
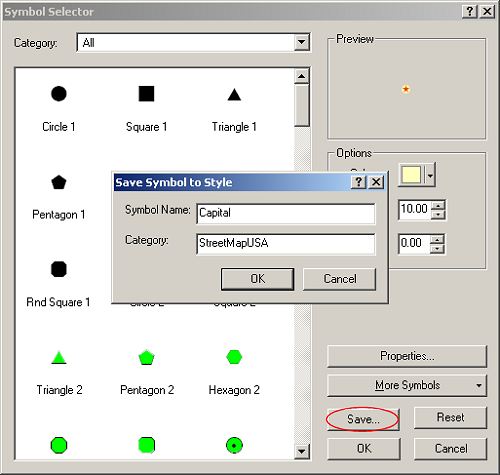
Bring up the Layer Properties, Symbology tab, and double click on the symbol to open the Symbol Selector. (For text labels you get to the Symbol Selector by going the Labels tab and pressing the Symbolģ button). On the symbol selector screen there is a Saveģ button. If you press it, it will ask you to give the symbol a name and a category.
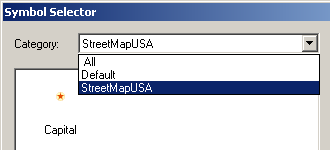
ThatÆs really all there is to it! Your saved symbol will now appear at the top of the list of symbol choices. It will be there whenever you open ArcMap from now on, available for use like any other symbol. In addition, if you go to the Category drop down you will be able to see only the symbols in the category you just created. So, for instance, I could save all the ESRI Streetmap symbols I like, and give them that same category name to make them easy to find later. (Note: The new category may not show up right away, but if you open and close ArcMap it will be there next time).
So, how does ArcMap save these symbols and where does it look for them next time? It saves them into something called a .style file. Every custom symbol defintion that you save is stored in your personal style file, located in ApplicationDataESRIArcMapusername.style. The ESRI styles are stored in Program FilesArcGISStyles. Both your personal style and the default ESRI style load every time ArcMap does. You can access the other ESRI styles by clicking on the More Symbols button in the symbol selector.
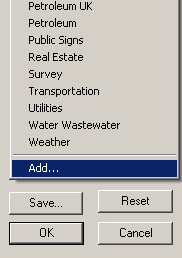
Just like layer files, you can manipulate these style files and share them with others. I found a cool one that Brady Davis shared back in 2005 to use as an example. He created a style based on Google Maps. You can download it at: http://conversationswithmyself.com/181/ Once you unpack it, you can add it to ArcMap by pressing the More Symbols button and selecting Addģ
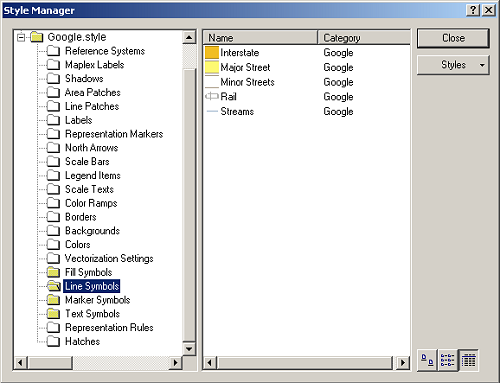
You can get to all the new Google symbols by navigating through the symbol selector for different symbol types. But if youÆd like to take a quick peek at everything all at once, thatÆs what the Style Manager is for.
You can open the Style Manager by going to Tools ¢> Styles ¢> Style Manager in the main ArcMap interface. You will see your personal style there, the ESRI default style, and any other styles that you may have added or turned on. HereÆs how the Google style looks
You can see from the folder names that you can control much more than just point, line, fill and text symbols with the style manager. Folders are colored yellow if they have something in them.
Also, with the style manager, you can create new styles, and copy and paste elements from one style into another. So, you could copy all your favorite symbols into you personal style. Or, you could create and populate a style specifically for sharing with others. You can also delete elements you donÆt like to reduce clutter.
In addition, Tools ¢> Style ¢> Style References lets you pick which styles will show up in the symbol selector window. So, you could create an mxd that only references a custom style you have created, thereby limiting the userÆs options to a list of standard symbols.
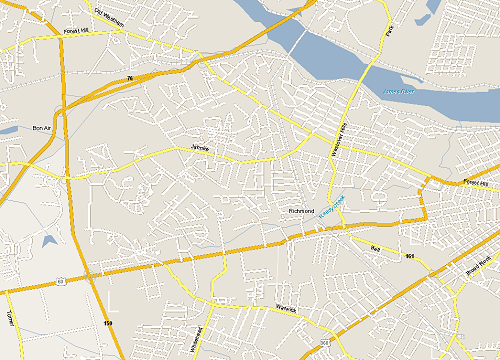
So, with just a little tweaking I used the Google style to googleize a section of downtown Richmond.
Text can be used in a variety of ways to enhance the information on a map. Maps convey information about geographic features, yet displaying only features on a mapŚeven with symbols that convey their meaningŚisn''t always enough to make your point. Adding text to your map improves the visualization of geographic information.
There are various uses for text that is added to your map. Descriptive text can be placed near individual map features. For example, you might add the name of each major city in Africa to your map. You can add text to draw attention to an area of the map, such as the general location of the Sahara. You can also add text that improves the presentation of your map. For example, a map title provides context; you might also consider adding other information such as map author, data source, and date.
Because text serves so many different mapping purposes, ArcGIS offers several different types. In ArcGIS, label, annotation, and graphic text have more specific meanings than they have in the general cartographic world. ArcGIS differentiates these terms by their function and storage models. All types of text are based on the same text symbol, therefore they support the same graphic abilities but they are each tailored to different situations. It is important to know the differences between these types of text when considering adding text to a map.
Labels
In ArcGIS, a label is a piece of text that is automatically positioned and whose text string is based on feature attributes. Labels offer the fastest and easiest way to add descriptive text for individual features to your map. For example, you can turn on dynamic labeling for a layer of major cities to quickly add all the city names to your map.
Automatic label positioning is performed by a label engine. The ESRI Standard Label Engine is provided with all license levels of ArcGIS. The Maplex for ArcGIS extension provides the ESRI Maplex Label Engine for advanced cartographic labeling. With labels, each time you draw your map document (for example, pan, zoom, and so on), label text is generated on-the-fly following the labeling properties you establish for each map layer.
To label your features, the first step is to add the Labeling toolbar. Use this toolbar to set various labeling options and to choose your desired labeling engine. If you have ArcInfo or if you have the Maplex for ArcGIS extension, you can choose Maplex as your labeling engine in the Labeling menu.
Next, use the Label Manager to set up labeling properties and rules for all layers you want to label within the data frame. Choose the attribute field that will be used as the source for the label text, set the properties of the text symbol, and establish placement rules and priorities for placing text labels on your map.
Annotation
Annotation can be used to describe particular features or add general information to the map. You can use annotation like labels, to add descriptive text for map features, or just add a few pieces of text manually to describe an area on your map. Unlike labels, each piece of annotation stores its own position, text string, and display properties. Compared to labels, annotation provides more flexibility over the appearance and placement of your text because you can select individual pieces of text and edit their position and appearance. You can use ArcMap to convert labels to annotation. Annotation can be further divided based on where it is stored: in a geodatabase, in a map document, or in one of the read-only formats that ArcGIS supports.
Geodatabase annotation is the native annotation type of ArcGIS. With this type, pieces of text or graphics are stored as features in a geodatabase annotation feature class. The text positions are stored in spatially referenced coordinates and are sized graphically according to the reference scale. Geodatabase annotation is fully editable using the ArcGIS editing tools. There are two types of geodatabase annotation. Standard annotation is geodatabase annotation that does not have a maintained link to any features. The other type, feature-linked annotation, is a special type of geodatabase annotation that is directly linked to features and has special updating behavior when the linked features are updated.
Map annotation consists of text or graphics stored in the map document. With this type of annotation, pieces of text or graphics are stored as elements in a map''s annotation group. A map can have multiple annotation groups to aid with organization. The text positions are stored in spatially referenced coordinates and are sized graphically according to the map scale or, optionally, a reference scale. Map annotation is fully editable using the ArcGIS graphic tools.
ArcGIS supports a variety of other annotation types as read-only data sources. These types include ArcInfo Workstation coverage, PC ARC/INFO coverage, Spatial Database Engine (SDE) 3.x, computer-aided design (CAD), and Vector Product Format (VPF) annotation. ArcGIS provides tools to convert them to geodatabase annotation or map document annotation, both of which are editable formats.
Graphic text
Text is also a fundamental part of page design in the page layout view in ArcMap. This type of text is called graphic text and is useful for adding information on and around your map that exists in page spaceŚas opposed to annotation, which is stored in geographic space. Graphic text editing is performed using the graphic editing tools and can only be added to ArcMap in layout view. Some examples of graphic text include titles and explanatory paragraphs, and notes, such as the projection used, date, author, and data source.
Common tasks with text
Common task Where to go for more information
Creating text symbols and styles (used throughout ArcGIS, in labels, annotation, graphic text, legends, and so on) Creating text symbols
Adding labels to a map Displaying labels
Prioritizing and positioning labels
Creating annotation from labels Converting labels to annotation
Adding titles and other text to a layout Adding new text to a map
Working with titles
Creating new annotation Creating new annotation features
Working with feature-linked annotation Using feature-linked annotation
Editing feature-linked annotation
Importing other annotation formats into ArcGIS Importing coverage or CAD annotation into geodatabase annotation
Importing SDE 3, VPF, or PC ARC/INFO coverage annotation