 | ArcGIS windows and tools |
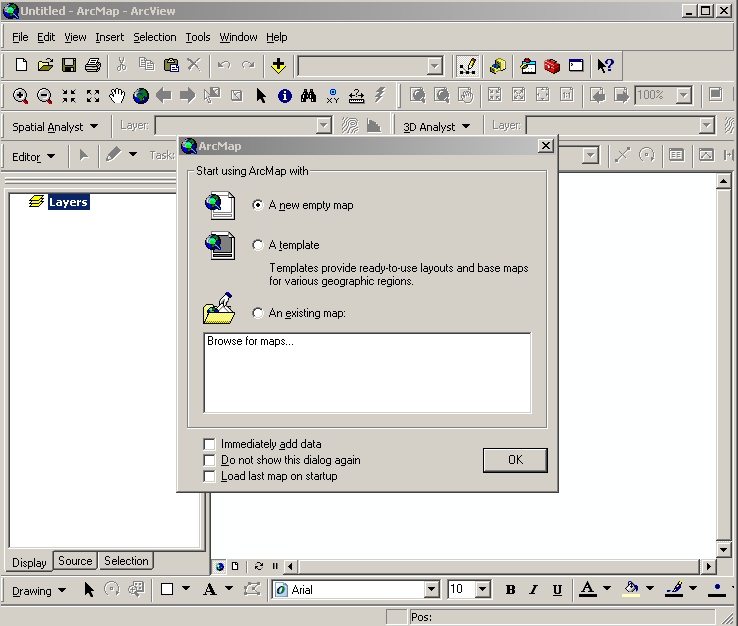
ArcMap dialog box |
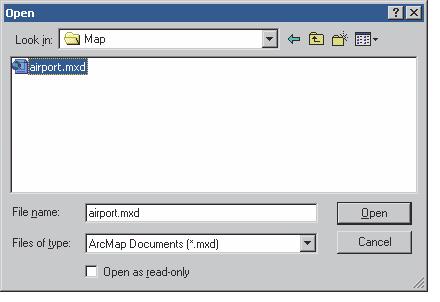
ArcMap open file dialog box |
Map Display (View) |
ArcMap Document with table of contents on left and map display on right |
Every map has a table of contents. The table of contents contains entries for the data used in the map. The display tab of the table of contents shows how layers are organized within data frames- .http://webhelp.esri.com/arcgisdesktop/9.2/index.cfm?TopicName=Using_the_table_of_contents |
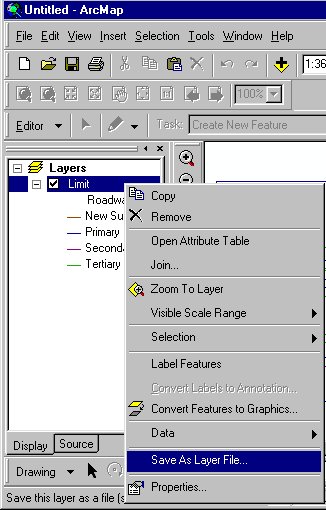
Opening context menus from ArcMap layer |
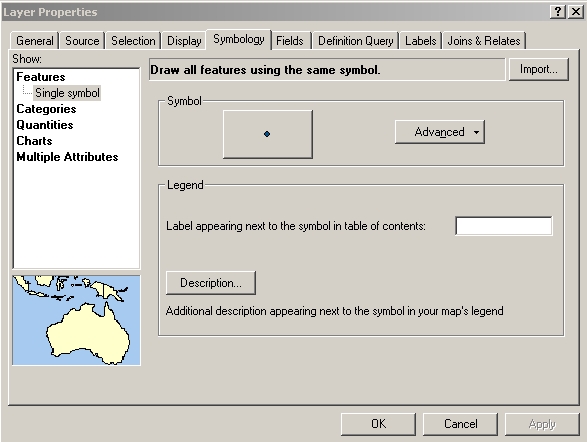
The Layer Properties Dialog box (menu) |
Layout view |
|
|
http://mchp-appserv.cpe.umanitoba.ca/teaching/GISmanual/view_layout.shtml |
data frame |
Multiple data frame |
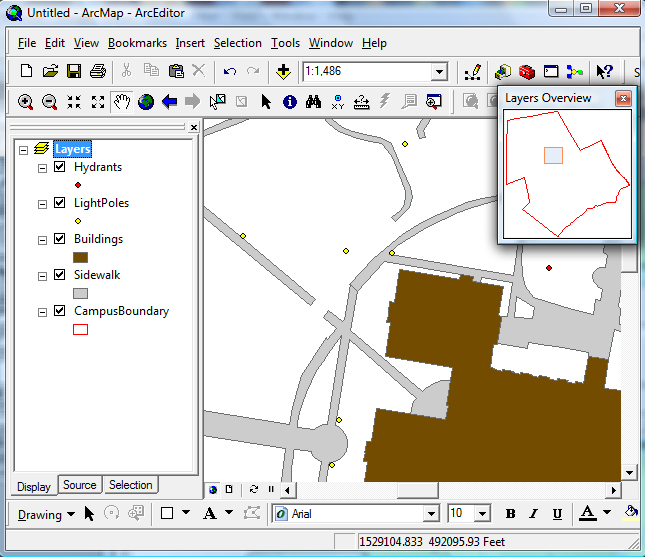
Map Window overview |
Map Window overview |
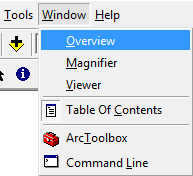
1. Click Overview from Window Menu. |
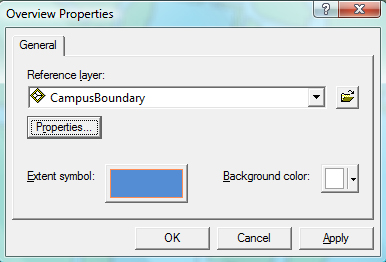
2. Next change the properties by right clicking on the Overview Window header to open the properties. Here you can change your reference layer, extent symbol and background color |
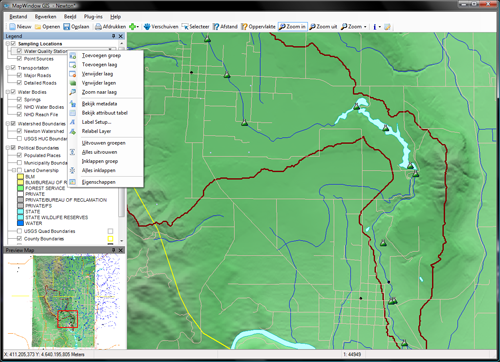
Here is an example of the Layer Overview window in use |
Show overview map: Display the Overview window by clicking the overview icon. in the Toolbar (if the icon is not present, no overview map is available). |
The Overview window displays a small map with a larger extent than the current map |
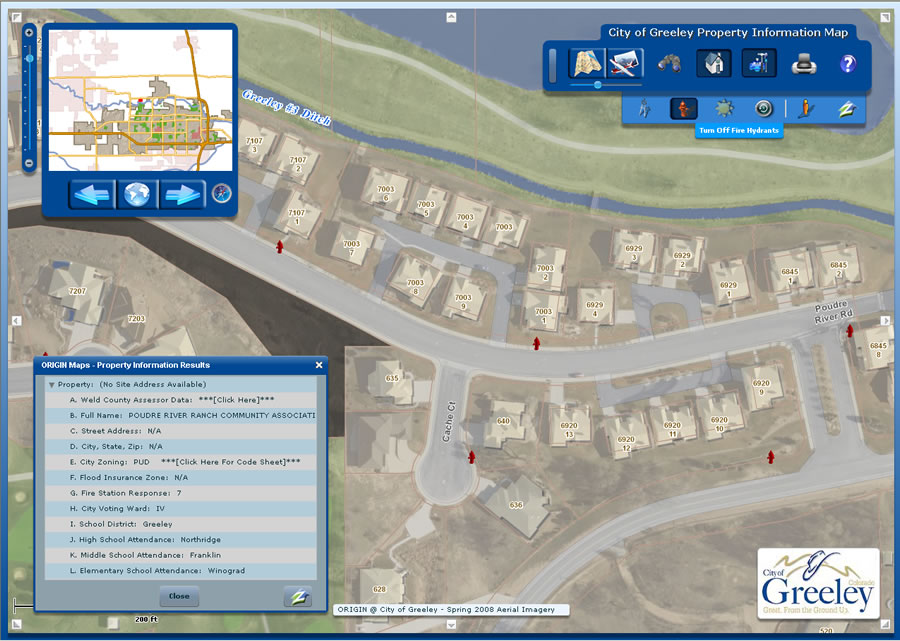
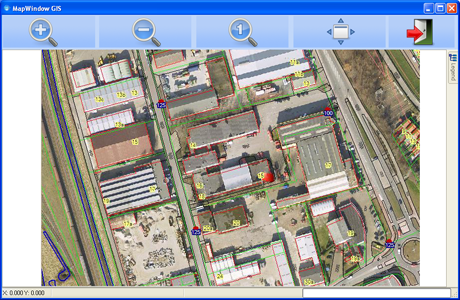
The Magnifier window allows a close-up view of a small portion of the main map.Magnifier moving to new location |
Magnifier displaying zoomed view |
To display the Magnifier window, click the Magnifier icon on the toolbar |
http://www.youtube.com/watch?v=v-mSF1QO5_Q -bookmarks manages |
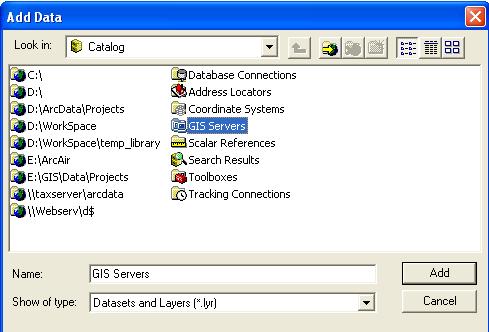
add data buttom or File-Add Data |
Connect to folder |
Add data dialog box |
The most commonly used datasets (data types): shapefiles,coverage, GRID,TIN Geodatabase right site of window |
|
|


ArcMap
ArcMAP is a desktop tool used for map creation. GIS data is brought into the work area and can be rendered accordingly. ArcMap can be used to make professional quality cartographic maps. In addition, arcMap can be used for any spatial anaysis of the GIS data as well as data manipulation or conversions. The ArcMap document can also be created to server through the internet via ArcGIS Server or ArcIMS.
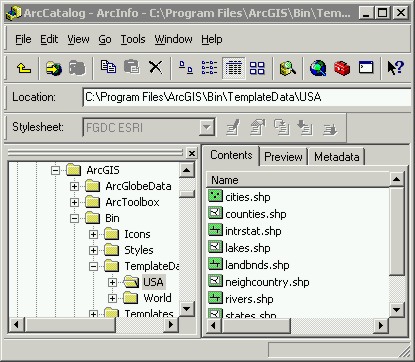
ArcCatalog
ArcCatalog is an explorer type interface that allows an administrator to manage GIS data and storage. Data can be created, loaded, removed in this environment as well as setting up services to retrieve external data as well as creation of geocoding services
ArcToolbox
ArcToolbox is a set of tools used in ArcMap and ArcCatalog to do any data manipulation, conversion, spatial projection, and spatial analysis of the data. Models can be setup in ArcToolbox to process multiple tools on the data in a continuous flow. New tools be can purchased as extentions or even created using Visual Basic for Applications, ArcObjects, or Python API.
Task
IMPUT
-creating new layer
-heads-up digitizing
-importing data
MANAGEMENT
-coping and moving data sets
-setting projection information
-metadata
-searching
--re-projecting
-building topology
ANALYSIS
-query
-buffering
-geo-processing
-overlay
-modeling
OUTPUT
map design and layout
-export to *.e00
-export to graphics
-export to interacting map
-export to other map formats
-print to plotter
ARCMAP BASIC
Open an existing map document:
1.File-Open
2.Navigate to folder
3.Select *.mxd file from
folder
A map document consists of two panels: the Table of Contents on the left and the map display.
Every map has a table of contents. The table of contents contains entries for the data used in the map. The display tab of the table of contents shows how layers are organized within data frames.
The table of contents is used primarily to turn layers on and off, access the properties of layers, and rearrange layers to change the drawing order. You can display the table of contents with the Display, Source, or Selection tabs.
The Display tab shows the layers in each data frame with the layers sorted by drawing order. Layers at the top of the list are drawn on top of layers lower in the list. You can drag and drop layers up and down in the list to control the drawing order. In the example graphic, the hillshade.img raster layer draws under the other layers, since it''''s at the bottom of the list of layers.
The Source tab shows the layers in each data frame with the layers organized by the folders or databases in which the data sources referenced by the layers can be found. This view will also list tables that have been added to the map document as data.
The Selection tab shows a list of the layers in the active data frame and lets you check the ones you want to make selectable. This tab works like the Set Selectable Layers dialog box accessed from the Selection menu.
You can adjust the look of the table of contents. For example, you might change the text size and font so that it makes a greater visual impact or is easier to read, or you might want to change the shape of the lines and patches that represent the features on a map. You can also dock the table of contents to the ArcMap interface, or you can make it a floating window, as in the graphic above
All the layers contained within the map document are listed in the Table of Contents.
Layers are organized within a Data-Frame (the combined map display and Table of Contents) and share the same coordinate system.
A data frame is the most fundamental element in a map document and in the ArcMap user interface. When you create a map, it contains a default data frame listed in the table of contents as Layers - http://webhelp.esri.com/arcgisdesktop/9.2/index.cfm?TopicName=Working_with_data_frames
A map document may support multiple data frames. If tere is more than one data frame in a map document, the actiwe data frame is shown in bold.
Data Frames can be expanded or contracted to control the complexity of the Table of Contents.
View Display Options: two types of display for a data: map display (or map view)for spacial data and layout view for legends, scalebars and North arrow to compose a map,and usually for exporting and printing.All data frames are vosoble in layput view.
VIEW DUISPLAY OPTIONS
There are two types for data display: map displays (or map view) and layout view. All data frames are visible in layout view even for multiple data frames in the same layout.
OVERLAY AND MAGNIFIER WINDOW
Two other ways to ôviewö maps is by using either the overwiew window or magnified window.
1. Select Window-Overview (or Magnifier) tools
2. Click and drag on floating window.
A valuable tool in ArcMap that sometimes goes unnoticed is the Layers Overview Window. When working on a map while zoomed in it is very easy to loose perspective of the actual location as compared to the overall map. This can also be true when analyzing a feature class by zooming to selected records from the attribute table. You usually have to stop and zoom out a significant amount to determine the location. However, with the Layers Overview Window you can always know the area for which you are working.
Another way: The Overview window displays a small map with a larger extent than the current map. The current map''s extent is shown in this window with a red rectangle.
As you zoom the map in or out, the Overview map''s extent may change so it shows an area somewhat larger than the main map.
The Overview map may look different from the main map. Layers may be visible at different map scales (zoom levels). Also, if the website uses multiple map services, only one will display in the Overview map
To display the Magnifier window, click the Magnifier icon on the Toolbar.
Ľ Magnifier window can be moved, collapsed and closed as desired. See Getting Started for details.
Ľ To magnify an area of the map, move the Magnifier window over the area by dragging on its title bar. A small red rectangle shows the area that will be magnified. Once you drop the Magnifier on a location, a zoomed-in view of the area will display within the Magnifier window.
Ľ The amount of magnification can be changed with the drop-down list in the lower left of the Magnifier window.
If the website uses multiple map services, only one of them will display in the Magnifier window. The administrator can set the map service to be used.
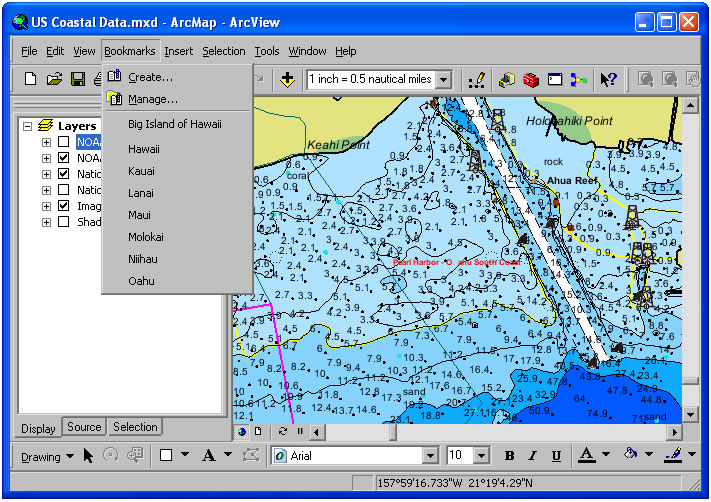
SETTING A SPATIAL BOOKMARK
1. Navigate to a desired spatial extent
2. SelectView-Bookmarks-Create
3. Type in a name
4. OK
Bookmarks allow you to quickly navigate to pre-defined geographic extent rectangles and can be extremely useful for data quality assessment when your data is located across a large area
A spatial bookmark identifies a particular geographic location that you want to save and reference later. For example, you might create a spatial bookmark that identifies a study area. As you pan and zoom around your map, you can easily return to the study area by accessing the bookmark. You can also use spatial bookmarks to highlight areas on your map you want others to see.
LAYERS
A layer (*.lyr) file can be store either the symbology or a specific representation of a data set. Any joins or relates will be included with the layer. The layers does not store the data itself. You can create a ôshortcutö to the data itself using the folder connection icon. c:esriesridata. For multiple folders create multiple connections.
ArcGIS can support a number of data types: shapefiles, geodatabases, coverages, TINS, and GRIGS.
To add layers from the GISPUBLIC directory in ArcMap:
Ľ Click the ôAdd Dataö icon.
Ľ A browser window will show all available storage connections.
Ľ Click on the ôepsci.wustl.edugispublicö drive.
Ľ Browse to files of interest and select to add.
HOW TO WORK
Copying and pasting features
http://webhelp.esri.com/arcgisdesktop/9.2/index.cfm?TopicName=Copying_and_pasting_features
About selecting features interactively
http://webhelp.esri.com/arcgisdesktop/9.2/index.cfm?TopicName=Selecting_features_interactively
About the table of contents
Every map has a table of contents. The table of contents contains entries for the data used in the map. The display tab of the table of contents shows how layers are organized within data frames.
The table of contents is used primarily to turn layers on and off, access the properties of layers, and rearrange layers to change the drawing order. You can display the table of contents with the Display, Source, or Selection tabs.
http://webhelp.esri.com/arcgisdesktop/9.2/index.cfm?TopicName=Using_the_table_of_contents
Layers, data frames, and the table of contents
How layers reference data
A layer references the data contained in coverages, shapefiles, geodatabases, images, grids, and so on. Referencing data in this way allows the layers on a map to automatically reflect the most up-to-date information in your GIS database. Layers do not store the actual geographic data.
The table of contents
The table of contents lists all the layers on the map and shows what the features in each layer represent. The check box next to each layer indicates whether or not the layer is currently drawn on the map. By default, the table of contents is located on the left side of the ArcMap window.
The order of layers within the table of contents is also important; the layers at the top draw on top of those below them. Thus, you''ll put the layers that form the background of your map, such as the ocean, at the bottom of the table of contents.
Learn how to change the drawing order of a layer
Organizing layers into data frames
Layers in the table of contents can be further organized into data frames. A data frame groups, in a separate frame, the layers you want to display together. You always get a data frame when you create a map; it''s listed at the top of the table of contents as Layers, but you can change the name to something more specific to your data.
Learn how to rename a data frame
Using more than one data frame
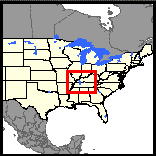
You may want to add data frames when you need to compare layers side by side or create insets and overviews. For example, suppose you need to show in which state your study area is. You could have one data frame with your study area and use another data frame with the state boundary as an inset map.
When a map has more than one data frame, one of them is the active data frame. The active data frame is the one you''re currently working with. When you add a new layer to a map, it is added to the active data frame. You can always tell which data frame is active because it''s highlighted on the map and its name is shown in bold text in the table of contents.
http://webhelp.esri.com/arcgisdesktop/9.2/index.cfm?TopicName=Layers%2C_data_frames%2C_and_the_table_of_contents
About data frames
A data frame is the most fundamental element in a map document and in the ArcMap user interface. When you create a map, it contains a default data frame listed in the table of contents as Layers.
The properties of a data frame define the context for the data with which you work; these include the coordinate system, measurement units, scale, the drawing order of layers, and so on. In ArcMap, data view isolates the contents of a data frame for you to edit or work with.
Data frames and the table of contents are the primary ways to interact with geographic data in ArcMap. Data frames can be set to show data at all scales and extents, a specific scale, or a specific extent, depending on what you need your map to do. You can navigate or change the extent of a data frame to view data for specific locations using the pan and zoom tools in ArcMap.
ArcMap has some requirements with respect to the data frame, which are
Ľ A map must have at least one data frame. If you delete the only data frame while in layout view, it is immediately replaced.
Ľ ArcMap always has an active data frame. This is the default target for many of the tools and commands in the ArcMap user interface.
Ľ You may only edit the features in one data frame at a time.
Ľ When you add data to a map, it must be added into a specific data frame.
The layers in a data frame display in the same coordinate system and may overlap. To compare layers side by side or to create insets and overviews that highlight an area by using layers that don''t overlap, add additional data frames to your map
http://webhelp.esri.com/arcgisdesktop/9.2/index.cfm?TopicName=Working_with_data_frames
About adding layers to a map
Geographic data is represented on a map as a layer. A layer might represent a particular type of feature, such as highways, lakes, or wildlife habitats, or it might represent a particular type of data such as a satellite image, a CAD drawing, or a terrain elevation surface in a triangulated irregular network (TIN). A layer defines how to display the geographic data it references and where that data is located in your database.
A layer references the data stored in geodatabases, coverages, shapefiles, rasters, and so on, rather than actually storing the geographic data. Thus, a layer always reflects the most up-to-date information in your database. A layer won''t draw on your map unless you also have access to the data source on which the layer is based.
It''s easy to add layers to a mapŚyou simply drag them from ArcCatalog to your map or add them with the Add Data button. Once they are on your map, you''ll typically organize them to make your map look the way you want it to. You organize and manage layers through the table of contents.
A layer at the top of the table of contents draws on top of those below it. Thus you''ll place layers that form the background of your map, such as an ocean layer, at the bottom of the table of contents
http://webhelp.esri.com/arcgisdesktop/9.2/index.cfm?TopicName=Adding_layers_to_a_map
Creating a layer from the data
1. Right-click the data source from which you want to create a layer.
2. Click Create Layer.
3. Navigate to the folder in which you want to save the layer.
4. Type a name for the layer file.
5. Click Save.
Creating the layer - http://webhelp.esri.com/arcgisdesktop/9.1/index.cfm?TopicName=Creating%20a%20layer
The most commonly used datasets (data types): shapefiles,coverage, GRID,TIN Geodatabase: *.shp ľ shapefile
*.lyr ľlayer
*.mdb ľ mega data base
*.dbf ľdBASE Table
ArcMap Tutorial
ArcGis: ArcMap Layout View
Adding and Accessing the Data. Layers
Use the Tool Bar
Editing Session