 | 2or3D Feature Analysis |
Rose diagrams (full or half) |
uni-or-bi-directional |
Variable petal width |
Lineation gridding |
strike&dip |
Movement analysis |
Stereonet diagrams |
Stereo great circles |
Unique symbols |
statistics |
Stereo contours |
2D or 3D potentiometric surface map |
periodic table |
structural and trigonometric computations |
measurement unit conversions |
financial utilities |
contour_map |
Contaminant Plume Modeling & Visualization |
2D Feature Analysis: Rose diagrams (full or half) created from azimuth bearing or line endpoint data from the RockWorks data sheet. Data interpreted as uni-or bi-directional; may be rotated and filtered (by length and/or direction). Variable petal width, optional statistical legend and mean ray and error, and easy modification of title, reference rays and circles. Lineation gridding tools offer 2D and 3D maps of lineation frequencies, lengths, intersections, or a combination, reported as real number, normalized, or standardized values. Lineation maps, arrow maps, and strike&dip maps illustrate lineations and planes on a 2D maps. Compute azimuth, line length, and lineation midpoint for line endpoint data. Movement analysis computes direction, distance, inclination, and velocity data from X, Y, Z, and time data. Import DXF Line and Polyline entities into the data sheet.
3D Feature Analysis: Stereonet diagrams created from strike and dip (or dip-direction, dip-angle) data; plot linear, planar, or rake features. Planar data plotted as great circles or pole (normal). Unique symbols for each sample or groups of samples. Mean directional vectors, statistics, symbol index, and legend. Optional contours and/or color-filled contours to illustrate point density; density grid computed using step function or spherical Gaussian technique. Other options: rotation of planar data, computation of planar intersection lineations, conversion of rake information to lineations. Equal area (Schmidt) or equal angle (Wulff) projections.
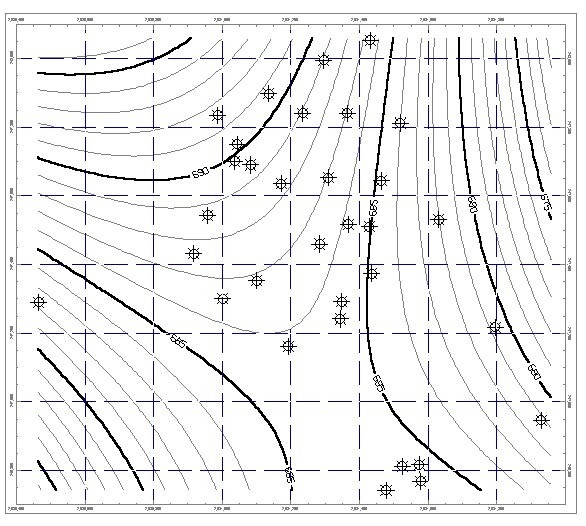
Hydrology: Compute drawdown for a single well using the Theis equation and display as report and/or diagram. Compute drawdown for multiple pumping or injection wells listed in data sheet (also using Theis equation), display as 2D or 3D potentiometric surface map.
Digitizing: Digitizing of points and individual lines directly into the data sheet, using an electronic digitizing tablet (not supplied with program). Requires installation of the "Wintab32" driver supplied by the digitizer manufacturer.
Coordinate Conversions: Translate XY coordinates listed in RockWorks data sheet: Longitude / latitude to/from UTM (feet or meters), decimal degrees to/from degree-minute-second, polar (bearing and distance) to/from XY. Also convert azimuth bearings to quadrant, quadrant to azimuth bearing. Rescale, rotate, and shift XY coordinates.
Geological Tools: Three-point contouring, periodic table of the elements, geologic time scale, structural and trigonometric computations, geometry computations, measurement unit conversions (length, area, mass, etc.), financial utilities.
Export: Graphics files export to DXF, BMP, JPG, EMF and WMF. Grid files exported to ASCII XYZ or matrix, DXF matrix, Ohio Automation ENZ, RockWare RTM, RockWorks DOS (v.7), Surfer (ASCII and binary), VistaPro. Solid model files to ASCII, NOeSYS, Slicer Dicer formats.
Other System Features: Symbol, pattern, and text editors, graphics file rescaling and combining, printer/plotter output with full scaling. Context-sensitive Help messages, on-line "cue card" tutorials, toolbar "speed" buttons, customize RockWorks menus and toolbars.
Minimum System Requirements: IBM-compatible computer running Windows95, Window98 or WindowsNT, 8megabytes of RAM, and 30 megabytes of free disk space for program and sample files. Supports most Windows-supported peripherals


