 | GEOGRAPHICAL DATA ANALYSIS |
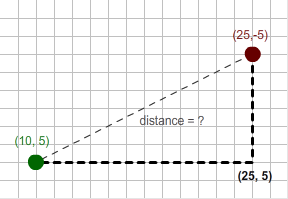
Raster GIS measurements - Pythagorian distance |
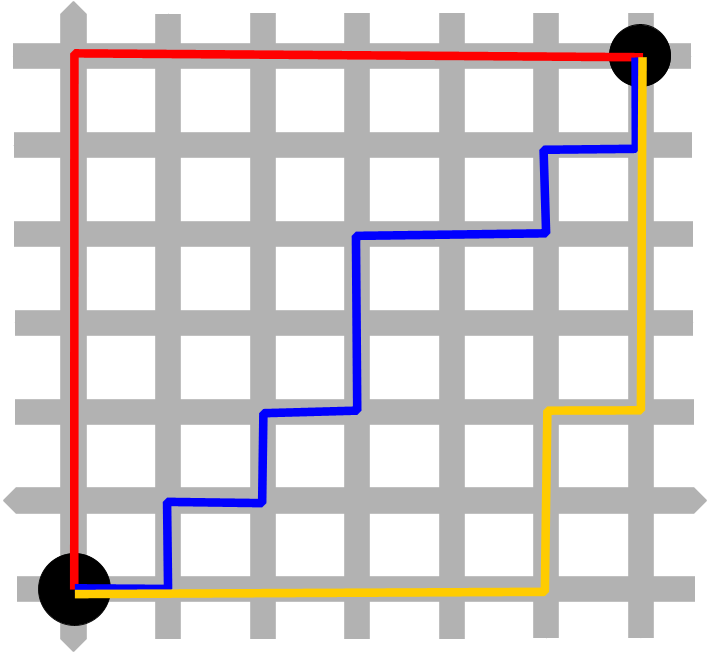
Manchettan distance, raster GIS |
vector distance measurement |
"problem-solving" approach: REAL WORLD -> MODEL -> DECISION |
the way we handle/manage information is by creating MODELS |
WHAT IS IN A NUMBER? |
OVERLAY |
neighbords |
CARTOGRAPHIC MODELLING |
IMPLEMENTING GIS |
terrian |
Edge-matching |
Line Coordinate Thinning |
Overlay - Region Wide Overlay: "Cookie Cutter Approach" |
Topological Overlay |
vector point-in-polygon analysis - a line can cross polygon n times, be outside of polygon "no crossing", or have "point on boundary" |
raster overlay |
raster overlay - http://resources.esri.com/help/9.3/ArcGISengine/java/Gp_ToolRef/geoprocessing/overlay_analysis.htm |
raster overlay |


WHAT IS IN A NUMBER?
fundamentals of spatial analysis
classification of spatial analytical functions
attributes vs. space
raster vs. vector
single layer vs. multiple layer
single attribute operations
group, isolate, classify, scale
neighbourhood-based operations in raster
distance, length, area
slope: gradient and aspect
cummulative operations (e.g., watershed)
neighbourhood operations in vector
line intersection
buffer
area
interactions between attributes and geometry
OVERLAY
multiple layer operations
the requirement of geometric registration
the origins of map overlay
colour overlay, graphical overlay
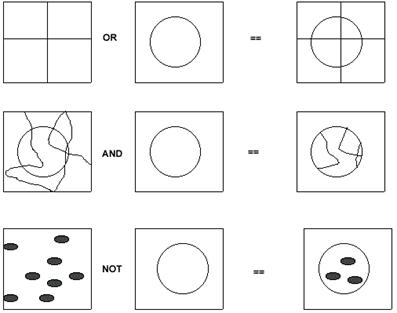
logical operators: attributes and space
vector overlay
point-in-polygon
line-in-polygon
area of a polygon
geometric selection
raster overlay
dominance, contribution, interaction rules
examples and flowcharts
TOWARD SPATIAL ANALYSIS
models and GIS
what? why? and how?
deterministic and stochastic models in SPACE
black-box, mass-balance, regression, spatial dependence
process and pattern
data, more data.... and sampling
interpolation
global and local interpolators
data qaulity / accuracy
CARTOGRAPHIC MODELLING
the origins of cartographic modelling
D. Tomlin and J. Berry
flowcharts
the graphical expression of logical sequence(s) of processing
from concepts to practice
the elements of steps, loops and decision-making
descriptive and predictive models
inductive and deductive approach to models
from simple to more complex models
testing and verification
map algebra
IMPLEMENTING GIS
the "management" issue:
awareness, requirements, evaluation, construction
cycles in GIS project management
what is the problem/task? (what is the question?)
what data, functionality and access do I need?
does it work?
can I afford it?
case study
forest mapping in BC
APPLYING GIS
careers in GIS...
what is education?
what is the market like?
what do you want to do?
experiences in natural resource management
basic courses and specialization
experiences in business
basic knowledge and skills
curriculum/courses in GIS
MORE ON APPLICATIONS
the social motivation for GIS
from Babylon to GPS
environmental applications
climate/weather, forest fire, mining, wildlife
facilities management
city services (road, power, phone, water networks)
interdisciplinary applications
health and the environment, sustainable development
the Wisconsin wetlands project
store-location: siting flowchart
GISCIENCE
geographical vocabulary
distributions, samples, measures
from real world through data models to database representation
measurement frameworks
spatial relationships
psychology (Piaget) and philosophy (Lakoff): the roots
what er things? (ontology)
topology and lingusitics (the interior, exterior, boundary model)
geographical and spatially-explicit modelling
flow-charts (!)
managing a project (the "cycle")
Spatial Data Functions
Spatial data refers to information about the location and shape of, and relationships among, geographic features, usually stored as coordinates and topology. Spatial data functions are used to transform spatial data files, such as digitized map, edit them, and assess their accuracy. They are mainly concerned with the spatial data.
Format Transformations
Format is the pattern into which data are systematically arranged for use on a computer. Format transformations are used to get data into acceptable GIS format. Digital Files must be transformed into the data format used by the GIS, such as transforming from raster to vector data structure. A raster data often requires no re-formatting. A vector data often requires topology to be built from coordinate data, such as arc/node translations. Transformation can be very costly and time-consuming with poor coordinate data.
Geometric Transformations
Geometric transformations are used to assign ground coordinates to a map or data layer within the GIS or to adjust one data layer so it can be correctly overlayed on another of the same area. The procedure used to accomplish this correction is termed registration.
Two approaches are used in registration: the adjustment of absolute positions and the adjustment of relative position. Relative Position refers to the location of features in relation to a geographic coordinate system. Rubber sheeting (registration by Relative Position) is the procedure using "slave" and "master" mathematical transformations to adjust coverage features in a nonuniform manner. Links representing from- and to-locations are used to define the adjustment. It needs easily identifiable, accurate, well distributed control points. Absolute Position is the location in relation to the ground. This registration is done by individual layers. The advantage is that it does not propagate errors.
Projection Transformations
Map projection is a mathematical transformation that is used to represent a spherical surface on a flat map. The transformation assigns to each location on a spherical surface a unique location on a 2-dimensional map.
Map projections always causes some distortion: area, shape, distance, or direction distortion. GIS commonly supports several projections and has software to transform data from one projection to another. The map projections most commonly used for mapping at scales of 1:500,000 or larger in North America is the UTM(Universal Transverse Mercator) Projection. For maps of continental extent, the Albers, Lambert''s Azimuthal, and Polyconic projections are commonly used.
Conflation
Conflation is the procedure of reconciling the positions of corresponding features in different data layers. Conflation functions are used to reconcile these differences so that the corresponding features overlay precisely. This is important when data from several data layers are used in an analysis.
Edge-matching
Editing Functions
Editing functions are used to add, delete, and change the geographic position of features. Sliver or splinter polygons are thin polygons that are occurring along the borders of polygons following digitizing and the topological overlay of two or more coverages.
Address Matching is a mechanism for relating two files using address as the relate item. Geographic coordinates and attributes can be transferred from one address to the other. For example, a data file containing student addresses can be matched to a street coverage that contains addresses creating a point coverage of where the students live.
Line Coordinate Thinning
The Thinning function reviews all the coordinate data in a file, identifies and then removes unnecessary coordinates. Depending on scale, a number of coordinate pairs can often be significantly reduced without a perceived loss of detail
Integrated Analysis of Spatial and Attribute Data
Overlay
Overlay is a GIS operation in which layers with a common, registered map base are joined on the basis of their occupation of space. (Keith C. Clarke, 1997).
Point-in-Polygon and Line-In-Polygon
Point-in-Polygon is a topological overlay procedure which determines the spatial coincidence of points and polygons. Points are assigned the attributes of the polygons within which they fall. For example, this function can be used to analyze an address and find out if it (point) is located within a certain zip code area (polygon).
Line-in-Polygon is a spatial operation in which lines in one coverage are overlaid with polygons of another coverage to determine which lines, or portions of lines, are contained within the polygons. Polygon attributes are associated with corresponding lines in the resulting line coverage. For example, this function can be used to find out who will be affected when putting in a new powerline in an area.
In a vector-based GIS, the identification of points and lines contained within a polygon area is a specialized search function. In a raster-based GIS, it is essentially an overlay operation, with the polygons in one data layer and the points and/or lines in a second data layer.
Topographic Functions
Topography refers to the surface characteristics with continuously changing value over an area such as elevations, aeromagnetics, noise levels, income levels, and pollution levels. The topography of a land surface can be represented in a GIS by digital elevation data. An alternative form of representation is the Triangulated Irregular Network or TIN used in vector-based systems.
Topographic functions are used to calculate values that describe the topography at a specific geographic location or in the vicinity of the location. The two most commonly used terrain parameters are the slope and aspect, which are calculated using the elevation data of the neighbouring points.
Slope is the measure of change in surface value over distance, expressed in degrees or as a percentage. For example, a rise of 2 meters over a distance of 100 meters describes a 2% slope with an angle of 1.15. Mathematically, slope is referred to as the first derivative of the surface. The maximum slope is termed the gradient. In a raster format DEM, another grid where each cell is the slope at a certain position can be created, then the maximun difference can be found and the gradient can be determined. Aspect is the direction that a surface faces. Aspect is defined by the horizontal and vertical angles that the surface faces. In a raster format DEM, another grid can be created for aspect and a number can be assigned to a specific direction.
Sun intensity is the combination of slope and aspect. Illumination portrays the effect of shining a light onto a 3-dimensional surface. (Stan Aronoff, 1989).
Thiessen Polygons
Thiessen or voronoi polygons define individual areas of influence around each of a set of points. Thiessen polygons are polygons whose boundaries define the area that is closest to each point relative to all other points. Thiessen polygons are generated from a set of points. They are mathematically defined by the perpendicular bisectors of the lines between all points. A tin structure is used to create Thiessen polygons.
Interpolation
Interpolation is the procedure of predicting unknown values using the known values at neighboring locations. The quality of the interpolation results depends on the accuracy, number, and distribution of the known points used in the calculation and on how well the mathematical function correctly models the phenomenon.
GEOGRAPHICAL DATA ANALYSIS
Remoteness and GIS
GIS Analysis Functions
Geographic Information Systems (GIS), mapping and spatial data