 | GIS Modeling and Analysis |
Figure 4.2.3-2. Data patterns for map locations are depicted as floating balls in data space |
Figure 4.2.3-3. Clustering results can be roughly evaluated using basic statistics. |
Figure 4.2.4-1. The corn yield map (top) identifies the pattern to predict; the red and near-infrared maps (bottom) are used to build the spatial relationship. |
Figure 4.2.4-2. The joint conditions for the spectral response and corn yield maps are summarized in the scatter plots shown on the right |
Figure 4.2.4-3. The red and NIR maps are combined for NDVI value that is a better predictor of yield. |
Figure 4.2.5-1. A project area can be stratified based on prediction errors |
Figure 4.2.5-2. After stratification, prediction equations can be derived for each element |
Figure 4.2.5-3. Stratified and whole-field predictions can be compared using statistical techniques |
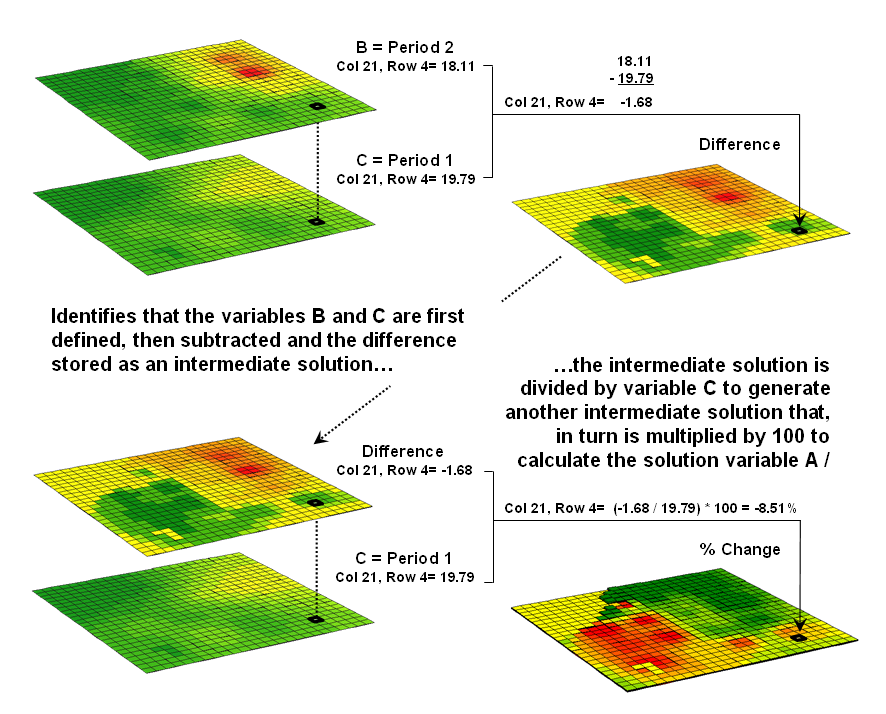
Figure 5.0-1. An iterative processing environment, analogous to basic math, is used to derive new map variables |
Figure 5.2-1. Areas of meadow and forest on a cover type map can be reclassified to isolate large areas of open water |
Figure 5.2-2. A sequence of reclassification operations (renumber, clump, size and renumber) can be used to isolate large water bodies from a cover type map |
Figure 5.3-1. Point-by point overlaying operations summarize the coincidence of two or more maps, such as assigning a unique value identifying the cover type and slope class conditions at each location |
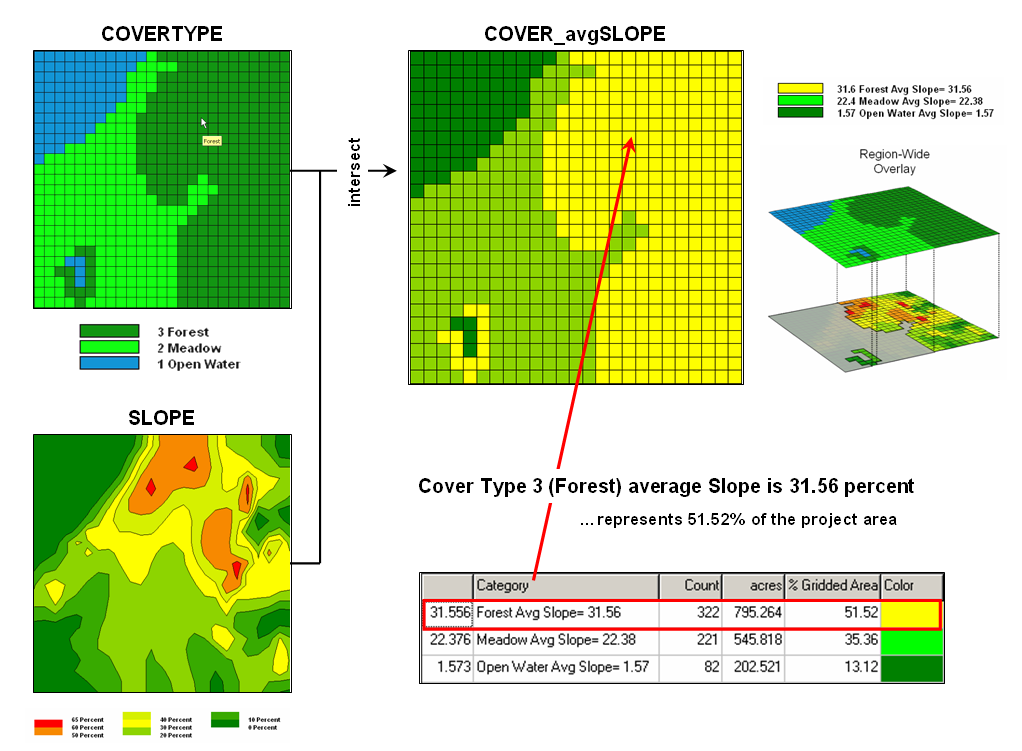
Figure 5.3-2. Category-wide overlay operations summarize the spatial coincidence of map categories, such as generating the average slope for each cover type category. |
Figure 5.4-1. Proximity identifies the set of shortest straight-lines among groups of points (distance zones). |
Figure 5.4-2. Proximity surfaces can be generated for groups of points, lines or polygons identifying the shortest distance from all location to the closest occurrence |
Figure 5.4-3. Effective Proximity surfaces consider the characteristics and conditions of movement throughout a project area |
Figure 5.4-4. Effective Distance waves are distorted as they encounter absolute and relative barriers, advancing faster under easy conditions and slower in difficult areas |
Figure 5.4-5. The basic set of distance operations can be extended by considering the dynamic nature of the implied movement |
Figure 5.5-1. The two fundamental classes of neighborhood analysis operations involve Characterizing Surface Configuration and Summarizing Map Values |
Figure 5.5-2. At a location, the eight individual slopes can be calculated for a 3x3 window and then summarized for the maximum, minimum, median and average slope |


Joseph K. Berry, W.M. Keck Visiting Scholar in Geosciences
Geography Department, University of Denver
Although GIS technology is just a few decades old, its analytical approaches have evolved as much as its mapping capabilities and practical expressions. In the 1960s analytical software development primarily occurred on campuses and its products relegated to library shelves. These formative years provided the basic organization for both data and processing structures found in a modern GIS. A raging debate centered on ōvector vs. rasterö formats and efficient algorithms for processingŚ technical considerations with minimal resonance outside of the small (but growing) group of innovators.
The early 1970s saw Computer Mapping automate the cartographic process. The points, lines and areas defining geographic features on a map were represented as organized sets of X,Y coordinates. In turn these data form input to a pen plotter that can rapidly update and redraw the connections at a variety of scales and projections. The map image, itself, is the focus of this processing.
The early 1980s exploited the change in the format and the computer environment of mapped data. Spatial Database Management Systems were developed that link computer mapping techniques to traditional database capabilities. The demand for spatially and thematically linked data focused attention on data issues. The result was an integrated processing environment addressing a wide variety of mapped data and digital map products.
During the 1990s a resurgence of attention was focused on analytical operations and a comprehensive theory of spatial analysis began to emerge. This "map-ematical" processing involves spatial statistics and spatial analysis. Spatial statistics has been used by geophysicists and climatologists since the 1950s to characterize the geographic distribution, or pattern, of mapped data. The statistics describe the spatial variation in the data, rather than assuming a typical response occurs everywhere within a project area.
Spatial analysis, on the other hand, expresses a geographic relationships as a series of map analysis steps, leading to a solution map in a manner analogous to basic algebra. Most of the traditional mathematical capabilities, plus an extensive set of advanced map analysis operations, are available in contemporary GIS software. You can add, subtract, multiply, divide, exponential, root, log, cosine, differentiate and even integrate maps. After all, maps in a GIS are just an organized set of numbers. However in map analysis, the spatial coincidence and juxtaposition of values among and within mapped data create new operations, such as effective distance, optimal path routing, visual exposure density, landscape diversity, shape and pattern.
GIS modeling encompasses the varied applications of the concepts, procedures and approaches ingrained spatial analysis and statistics. This chapter investigates a generalized framework supporting GIS modeling and analysis within a grid-based GIS environment.
Several sections and chapters in this manual address specific analytical and statistical techniques in more detail, as well as comprehensively describing additional modeling applications. In addition, the online book, Map Analysis: Procedures and Applications in GIS Modeling provides more detailed discussion of the material presented in each of the sections of this chapter (see AuthorÆs Note).
1.1 Mapping to Analysis of Mapped Data
The evolution (or is it a revolution?) of GIS technology has certainly taken it well beyond the traditional roles of mapping. For thousands of years maps were graphic representations of physical features primarily for the purpose of navigation. With the advent of geotechnology, maps have changed form to digital representations that are linked to databases and a host of new processing and analytical capabilities.
Figure 1.1-1 identifies two key trends in the movement from mapping to map analysis. Traditional GIS treats geographic space in a manner similar to our paper map legacy. Points, lines and polygons are used to define discrete spatial objects, such as houses, streams and lakes. In turn, these objects are linked to attributes in a database that describe their characteristics and conditions. The result is a tremendously useful system enabling users to make complex geo-queries of the information and then map the results.
Spatial Analysis extends the basic set of discrete map features of points, lines and polygons to map ōsurfacesö that represent continuous geographic space as a set of contiguous grid cell values. The consistency of this grid-based structuring provides the foothold for a wealth of new analytical tools for characterizing ōcontextual spatial relationships,ö such as identifying the visual exposure of an entire road network.
In addition, it provides a mathematical/statistical framework by numerically representing geographic space. Traditional Statistics is inherently non-spatial as it seeks to represent a data set by its typical response regardless of spatial patterns. The mean, standard deviation and other statistics are computed to describe the central tendency of the data in abstract numerical space without regard to the relative positioning of the data in real-world geographic space.
Spatial Statistics, on the other hand, extends traditional statistics on two fronts. First, it seeks to map the variation in a data set to show where unusual responses occur, instead of focusing on a single typical response. Secondly, it can uncover ōnumerical spatial relationshipsö within and among mapped data layers, such as generating a prediction map identifying where likely customers are within a city based on existing sales and demographic information.
1.2 Vector-based Mapping versus Grid-based Analysis
The close conceptual link of vector-based desktop mapping to manual mapping and traditional database management has fueled its rapid adoption. In many ways, a database is just picture waiting to happen. The direct link between attributes described as database records and their spatial characterization is easy to conceptualize. Geo-query enables clicking on a map to pop-up the attribute record for a location or searching a database then plotting all of the records meeting the query. Increasing data availability and Internet access, coupled with decreasing desktop mapping system costs and complexity, make the adoption of spatial database technology a practical reality.
Maps in their traditional form of points, lines and polygons identifying discrete spatial objects align with manual mapping concepts and experiences. Grid-based maps, on the other hand, represent a different paradigm of geographic space that opens entirely new ways to address complex issues. Whereas traditional vector maps emphasize æprecise placement of physical features,Æ grid maps seek to æanalytically characterize continuous geographic space in both real and cognitive terms.Æ
2.0 Fundamental Map Analysis Approaches
The tools for mapping database attributes can be extended to analysis of spatial relationships within and among mapped data layers. Two broad classes of capabilities form this extensionŚspatial statistics and spatial analysis.
2.1 Spatial Statistics
Spatial statistics can be grouped into two broad campsŚsurface modeling and spatial data mining. Surface modeling involves the translation of discrete point data into a continuous surface that represents the geographic distribution of the data. Traditional non-spatial statistics involves an analogous process when a numerical distribution (e.g., standard normal curve) is used to generalize the central tendency of a data set. The derived average and standard deviation reflects the typical response and provides a measure of how typical it is. This characterization seeks to explain data variation in terms of the numerical distribution of measurements without reference to the dataÆs geographic distribution and patterns.
In fact, an underlying assumption in most traditional statistical analyses is that the data is randomly or uniformly distributed in geographic space. If the data exhibits a geographic pattern (termed spatial autocorrelation) many of the non-spatial analysis techniques are less valid. Spatial statistics, on the other hand, utilizes inherent geographic patterns to further explain the variation in a set of sample data.
There are numerous techniques for characterizing the spatial distribution inherent in a data set but they can be categorized into four basic approaches:
- Point Density mapping that aggregates the number of points within a specified distance (number per acre),
- Spatial Interpolation that weight-averages measurements within a localized area (e.g., Kriging), and
- Map Generalization that fits a functional form to the entire data set (e.g., polynomial surface fitting).
- Geometric Facets that construct a map surface by tessellation (e.g., fitting a Triangular Irregular Network of facets to the sample data).
For example, consider figure 2.1-1 showing a point density map derived from a map identifying housing locations. The project area is divided into an analysis frame of 30-meter grid cells (100 columns x 100 rows = 10,000 grid cells). The number of houses for each grid space is identified in left portion of the figure as colored dots in the 2D map and ōspikesö in the 3D map.
A neighborhood summary operation is used to pass a ōroving windowö over the project area calculating the total number of houses within a quarter-mile of each map location. The result is a continuous map surface indicating the relative density of housesŚæpeaksÆ where there is a lot of nearby houses and ævalleysÆ where there are few or none. In essence, the map surface quantifies what your eye sees in the spiked mapŚsome locations with lots of houses and others with very few.
While surface modeling is used to derive continuous surfaces, spatial data mining seeks to uncover numerical relationships within and among mapped data. Some of the techniques include coincidence summary, proximal alignment, statistical tests, percent difference, surface configuration, level-slicing, and clustering that is used in comparing maps and assessing similarities in data patterns.
Another group of spatial data mining techniques focuses on developing predictive models. For example, one of the earliest uses of predictive modeling was in extending a test market project for a phone company (figure 2.1-2). CustomersÆ address were used to ōgeo-codeö map coordinates for sales of a new product enabling distinctly different rings to be assigned to a single phone lineŚone for the kids and one for the parents. Like pushpins on a map, the pattern of sales throughout the test market area emerged with some areas doing very well, while other areas sales were few and far between.
The demographic data for the city was analyzed to calculate a prediction equation between product sales and census block data. The prediction equation derived from the test market sales was applied to another city by evaluating exiting demographics to ōsolve the equationö for a predicted sales map. In turn the predicted map was combined with a wire-exchange map to identify switching facilities that required upgrading before release of the product in the new city.
2.2 Spatial Analysis
Whereas spatial data mining responds to ænumericalÆ relationships in mapped data, spatial analysis investigates the æcontextualÆ relationships. Tools such as slope/aspect, buffers, effective proximity, optimal path, visual exposure and shape analysis, fall into this class of spatial operators. Rather than statistical analysis of mapped data, these techniques examine geographic patterns, vicinity characteristics and connectivity among features.
One of the most frequently used map analysis techniques is Suitability Modeling. These applications seek to map the relative appropriateness of map locations for particular uses. For example, a map of the best locations for a campground might be modeled by preferences for being on gentle slopes, near roads, near water, good views of water and a southerly aspect
These spatial criteria can be organized into a flowchart of processing (see figure 2.2-1) where boxes identify maps and lines identify map analysis operations. Note that the rows of the flowchart identify decision criteria with boxes representing maps and lines representing map analysis operations. For example, the top row evaluates the preference to locate the campground on gentle slopes.
The first step calculates a slope map from the base map of elevation by entering the commandŚ
SLOPE Elevation Fitted FOR Slopemap
The derived slope values are then reclassified to identify locations of acceptable slopes by assigning 1 to slopes from 0 to 20 percentŚ
RENUMBER Slopemap ASSIGNING 1 TO 0 THRU 20
ASSIGNING 0 TO 20 THRU 1000 FOR OK_slope
Śand assigning 0 to unacceptably steep slopes that are greater than 20 percent.
In a similar manner, the other criteria are evaluated and represented by maps with a value of 1 assigned to acceptable areas (white) and 0 assigned to unacceptable areas (dark grey). The individual preference maps are combined by entering the commandŚ
CALCULATE OK_slope * OK_road * OK_water * OK_view * OK_aspect
FOR Campground_suitability
The map analysis procedure depicted in figure 2.2-1 simply substitutes values of 1 and 0 for suitable and non-suitable areas. The multiplication of the digital preference maps simulates stacking manual map overlays on a light-table. A location that computes to 1 (1*1*1*1*1= 1) corresponds to acceptable. Any numeric pattern with the value 0 will result in a product of 0 indicating an unacceptable area.
While some map analysis techniques are rooted in manual map processing, most are departures from traditional procedures. For example, the calculation of slope is much more exacting than ocular estimates of contour line spacing. And the calculation of visual exposure to water presents a completely new and useful concept in natural resources planning. Other procedures, such as optimal path routing, landscape fragmentation indices and variable-width buffers, offer a valuable new toolbox of analytical capabilities
GIS Modeling and Analysis next page
GIS Modeling and Analysis last page