 | Basics of Digital Mapping |
Vector vs. Raster Maps |
|
|
An Example of Raster and Vector Integration |
The Integration of Vector and Raster System Hybird System |
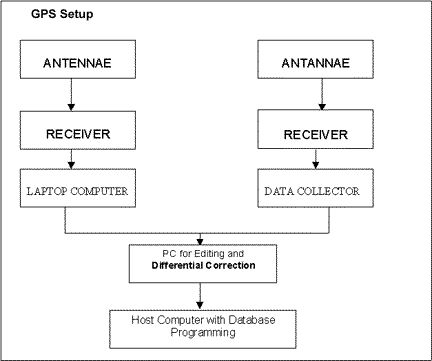
GPS setup |

Data: The Core of Your Mapping / GIS Project
When most people begin a GIS project, their immediate concern is with purchasing computer hardware and software. They enter into lengthy discussions with vendors about the merits of various components and carefully budget for acquisitions. Yet they often give little thought to the core of the system, the data that goes inside it. They fail to recognize that the choice of an initial data set has a tremendous influence on the ultimate success of their GIS project.
Data, the core of any GIS project, must be accurate - but accuracy is not enough. Having the appropriate level of accuracy is vital. Since an increase in data accuracy increases acquisition and maintenance costs, data that is too detailed for your needs can hurt a project just as surely as inaccurate data can. All any GIS project needs is data accurate enough to accomplish its objectives and no more. For example, you would not purchase an engineering workstation to run a simple word-processing application. Similarly, you would not need third-order survey accuracy for a GIS-based population study whose smallest unit of measurement is a county. Purchasing such data would be too costly and inappropriate for the project at hand. Even more critically, collecting overly complex data could be so time-consuming that the GIS project might lose support within the organization.
Even so, many people argue that, since GIS data can far outlast the hardware and software on which it runs, no expense should be spared in its creation. Perfection, however, is relative. Projects and data requirements evolve. Rather than overinvest in data, invest reasonably in a well-documented, well-understood data foundation that meets today''s needs and provides a path for future enhancements. This approach is a key to successful GIS project implementation.
Are Your Data Needs Simple or Complex?
Before you start your project, take some time to consider your objectives and your GIS data needs. Ask yourself, "Are my data needs complex or simple?"
*Italicized words can be found in the Glossary at the end of this document except for words used for emphasis or words italicized for reasons of copyediting convention or layout.
If you just need a map as a backdrop for other information, your data requirements are simple. You are building a map for your specific project, and you are primarily interested in displaying the necessary information, not in the map itself. You do not need highly accurate measurements of distances or areas or to combine maps from different sources. Nor do you want to edit or add to the map''s basic geographic information.
An example of simple data requirements is a map for a newspaper story that shows the location of a fire. Good presentation is important; absolute accuracy is not.
If you have simple data needs, read this paper to get the overall picture of what GIS data is and how it fits into your project. A project with simple data requirements can be started with inexpensive maps. Your primary interests will be quality graphic- display characteristics and finding maps that are easy to use with your software. You need not be as concerned with technical mapping issues. However, basic knowledge of concepts such as coordinate systems, absolute accuracy, and file formats will help you understand your choices and help you make informed decisions when it''s time to add to your system.
What issues suggest more complex GIS data needs?
Building a GIS to be used by many people over a long period of time.
Storing and maintaining database information about geographic features.
Making accurate engineering measurements from the map.
Editing or adding to the map.
Combining a variety of information from different sources.
An example of a system requiring complex data would be a GIS built to manage infrastructure for an electric utility.
If your data requirements are complex, you ought to pay particular attention to the sections of this paper that discuss data accuracy, coordinate systems, layering, file formats, and the issues involved in combining data from different sources.
Also keep in mind that projects evolve, and simple data needs expand into complex ones as your project moves beyond its original objectives. If you understand the basics of your data set, you will make better decisions as your project grows.
Basics of Digital Mapping
Vector vs. Raster Maps
The most fundamental concept to grasp about any type of graphic data is making the distinction between vector data and raster data. These two data types are as different as night and day, yet they can look the same. For example, a question that commonly comes up is "How can I convert my TIFF files into DXF files?" The answer is "With difficulty," because TIFF is a raster data format and DXFÖ (data interchange file) is a vector format. And converting from raster to vector is not simple. Raster maps are best suited to some applications while vector maps are suited to others.
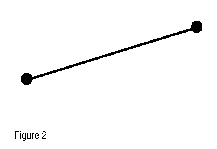
Raster data represents a graphic object as a pattern of dots, whereas vector data represents the object as a set of lines drawn between specific points. Consider a line drawn diagonally on a piece of paper. A raster file would represent this image by subdividing the paper into a matrix of small rectangles-similar to a sheet of graph paper-called cells (figure 1). Each cell is assigned a position in the data file and given a value based on the color at that position. White cells could be given the value 0; black cells, the value 1; grays would fall in-between. This data representation allows the user to easily reconstruct or visualize the original image
A vector representation of the same diagonal line would record the position of the line by simply recording the coordinates of its starting and ending points. Each point would be expressed as two or three numbers (depending on whether the representation was 2D or 3D, often referred to as X,Y or X,Y,Z coordinates (figure 2). The first number, X, is the distance between the point and the left side of the paper; Y, the distance between the point and the bottom of the paper; Z, the point''s elevation above or below the paper. The vector is formed by joining the measured points.
Some basic properties of raster and vector data are outlined below.
Each entity in a vector file appears as an individual data object. It is easy to record information about an object or to compute characteristics such as its exact length or surface area. It is much harder to derive this kind of information from a raster file because raster files contain little (and sometimes no) geometric information.
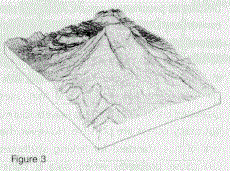
Some applications can be handled much more easily with raster techniques than with vector techniques. Raster works best for surface modeling and for applications where individual features are not important. For example, a raster surface model can be very useful for performing cut-and-fill analyses for road-building applications, but it doesn''t tell you much about the characteristics of the road itself. Terrain elevations can be recorded in a raster format and used to construct digital elevation models (DEMs) (figure 3). Some land-use information comes in raster format.
Raster files are often larger than vector files. The raster representation of the line in the example above required a data value for each cell on the page, whereas the vector representation only required the positions of two points.
The size of the cells in a raster file is an important factor. Smaller cells improve image quality because they increase detail. As cell size increases, image definition decreases or blurs. In the example, the position of the line''s edge is defined most clearly if the cells are very small. However, there is a trade-off: Dividing the cell size in half increases file size by a factor of four.
Cell size in a raster file is referred to as resolution. For a given resolution value, the raster cost does not increase with image complexity. That is, any scanner can quickly make a raster file. It takes no more effort to scan a map of a dense urban area than to scan a sparse rural one. On the other hand, a vector file requires careful measuring and recording of each point, so an urban map will be much more time-consuming to draw than a rural map. The process of making vector maps is not easily automated, and cost increases with map complexity.
Because raster data is often more repetitive and predictable, it can be compressed more easily than vector data. Many raster formats, such as TIFF, have compression options that drastically reduce image sizes, depending upon image complexity and variability.
Raster files are most often used:
For digital representations of aerial photographs, satellite images, scanned paper maps, and other applications with very detailed images.
When costs need to be kept down.
When the map does not require analysis of individual map features.
When "backdrop" maps are required.
In contrast, vector maps are appropriate for:
Highly precise applications.
When file sizes are important.
When individual map features require analysis.
When descriptive information must be stored.
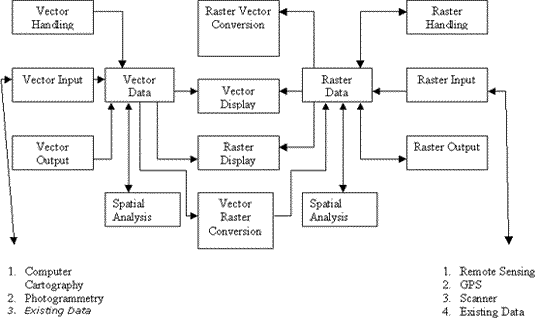
Raster and vector maps can also be combined visually. For example, a vector street map could be overlaid on a raster aerial photograph. The vector map would provide discrete information about individual street segments, the raster image, a backdrop of the surrounding environment.
Digital Map Formats- How Data Is Stored
The term file format refers to the logical structure used to store information in a GIS file. File formats are important in part because not every GIS software package supports all formats. If you want to use a data set, but it isn''t available in a format that your GIS supports, you will have to find a way to transform it, find another data set, or find another GIS.
Almost every GIS has its own internal file format. These formats are designed for optimal use inside the software and are often proprietary. They are not designed for use outside their native systems. Most systems also support transfer file formats. Transfer formats are designed to bring data in and out of the GIS software, so they are usually standardized and well documented.
If your data needs are simple, your main concern will be with the internal format that your GIS software supports. If you have complex data needs, you will want to learn about a wider range of transfer formats, especially if you want to mix data from different sources. Transfer formats will be required to import some data sets into your software.
Vector Formats
Many GIS applications are based on vector technology, so vector formats are the most common. They are also the most complex because there are many ways to store coordinates, attributes, attribute linkages, database structures, and display information. Some of the most common formats are briefly described below
Common Vector File Formats Format Name Software Platform Internal or Transfer Developer Comments
Arc Export ARC/INFO* Transfer Environmental Systems Research Institute, Inc. (ESRI) Transfers data across ARC/INFO* platforms.
ARC/INFO* Coverages ARC/INFO* Internal ESRI
AutoCAD Drawing Files (DWG) AutoCAD* Internal Autodesk
Autodesk Data Interchange File (DXFÖ) Many Transfer Autodesk Widely used graphics transfer standard.
Digital Line graphs (DLG) Many Transfer United States Geological Survey (USGS) Used to publish USGS digital maps.
Hewlett-Packard Graphic Language (HPGL) Many Internal Hewlett-Packard Used to control HP plotters.
MapInfo Data Transfer Files (MIF/MID) MapInfo* Transfer MapInfo Corp.
MapInfo Map Files MapInfo* Internal MapInfo Corp.
MicroStation Design Files (DGN) MicroStation* Internal Bentley Systems, Inc.
Spatial Data Transfer System (SDTS) Many (in the future) Transfer US Government New US standard for vector and raster geographic data.
Topologically Integrated Geographic Encoding and Referencing (TIGER) Many Transfer US Census Bureau Used to publish US Census Bureau maps.
Vector Product Format (VPF) Military mapping systems Both US Defense Mapping Agency Used to publish Digital Chart of the World.
Raster Formats
Raster files generally are used to store image information, such as scanned paper maps or aerial photographs. They are also used for data captured by satellite and other airborne imaging systems. Images from these systems are often referred to as remote-sensing data. Unlike other raster files, which express resolution in terms of cell size and dots per inch (dpi), resolution in remotely sensed images is expressed in meters, which indicates the size of the ground area covered by each cell.
Some common raster formats are described below Format Name Software Platform Internal or Transfer Developer Comments
Arc Digitized Raster Graphics (ADRG) Military mapping systems Both US Defense Mapping Agency
Band Interleaved by Line (BIL) Man Both Common remote-sensing standard.
Band Interleaved by Pixel (BIP) Many Both Common remote-sensing standard.
Band Sequential (BSQ) Many Both Common remote-sensing standard.
Digital Elevation Model for (DEM) Many Transfer United States Geological Survey (USGS) USGS standard format digital terrain models.
PC Paintbrush Exchange (PCX) PC Paintbrush Both Zsoft Widely used raster format.
Spatial Data Transfer Standard (SDTS) Many (in the future) Transfer US Federal Government New US standard for both raster and vector geographic data; raster version still under development.
Tagged Image File Format (TIFF) PageMaker Both Aldus Widely used raster format.
Vectors & Raster Data Models - Merits & Demerits.
RASTER MODEL VECTOR MODEL
Advantages
Simple data structure
Easy and efficient overlaying
Compatible with RS imagery
High spatial variability is efficiently represented
Simple for own programming
Same grid cells for several attributes
Disadvantages
Inefficient use of computer storage
Errors in perimeter, and shape
Difficult network analysis
Inefficient projection transformations
Loss of information when using large cells Less accurate (although interactive) maps
Advantages
Compact data structure
Efficient for network analysis
Efficient projection transformation
Accurate map output.
Disadvantages
Complex data structure
Difficult overlay operations
High spatial variability is inefficiently represented
Not compatible