 | History of GIS |
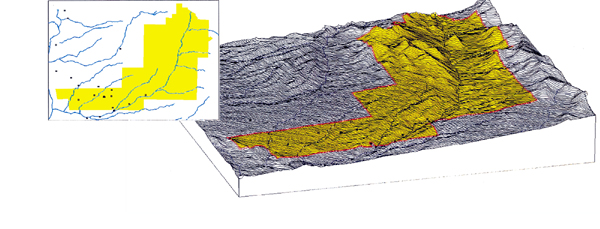
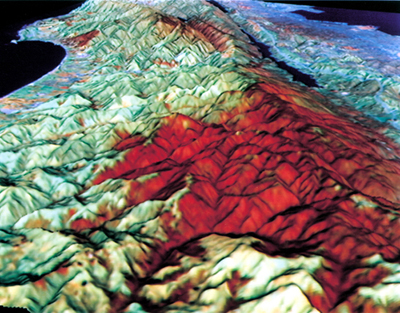
Figure 25. Prescott National Forest, showing altered topography due to mine development |
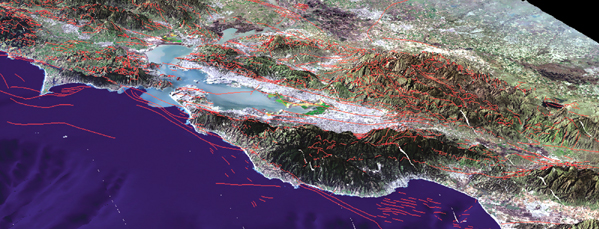
Figure 26. Three-dimensional image of the San Francisco Bay created to assess the potential of land and underwater avalanches. |
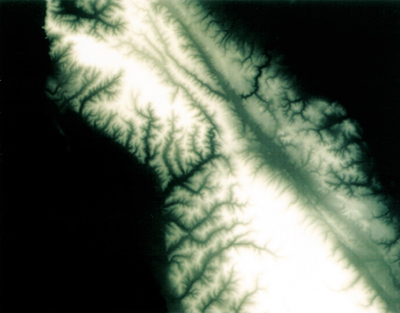
Figure 27. Digital elevation model of San Mateo County, Calif |
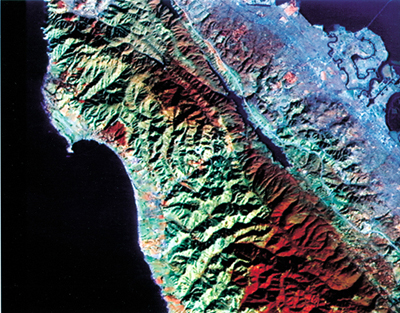
Figure 28. Landsat Thematic Mapper image of San Mateo County, Calif. |
Figure 29. Perspective view of San Mateo County, Calif. |
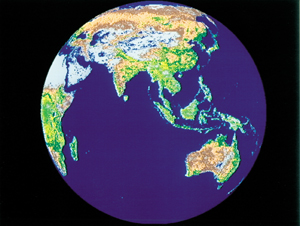
Figure 30. One time slice of the vegetation index for part of the globe from AVHRR data |
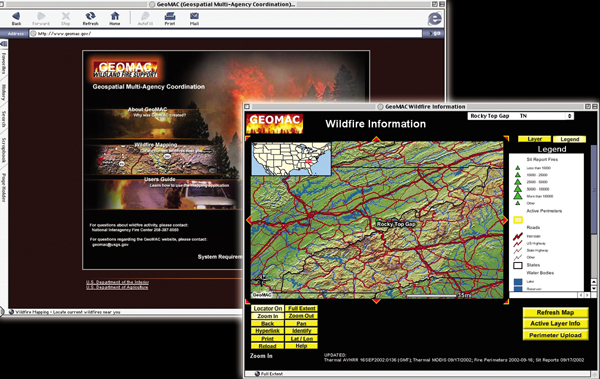
Figure 31. Wildfires burning for the past 24 hours accessible by means of a web browser and Internet map server GIS technology. |
HISTORY OF GIS
A. INTRODUCTION
B. HISTORIC USE OF MULTIPLE THEME MAPS
C. EARLY COMPUTER ERA
D. CANADA GEOGRAPHIC INFORMATION SYSTEM (CGIS)
Purpose
Technological innovations
Key innovative ideas in CGIS
Key individual
E. HARVARD LABORATORY
The Harvard packages
Key individuals
F. BUREAU OF THE CENSUS
DIME files
Urban atlases
G. ESRI
REFERENCES
This unit provides a very brief review of some important milestones in the development of GIS. Of course, it is likely there are some important stages we have omitted. It is perhaps a little too early yet to get a good perspective on the history of GIS.
UNIT 23 - HISTORY OF GIS
A. INTRODUCTION
development of GIS was influenced by:
o key groups, companies and individuals
o timely development of key concepts
content of this unit is concerned with North America
outside North America, significant developments occurred at the Experimental Cartography Unit in the UK
o history of this group has been documented by Rhind (1988)
this unit draws on a preliminary "genealogy of GIS" assembled in 1989 by Donald Cooke of Geographic Data Technologies Inc.
B. HISTORIC USE OF MULTIPLE THEME MAPS
idea of portraying different layers of data on a series of base maps, and relating things geographically, has been around much longer than computers
o maps of the Battle of Yorktown (American Revolution) drawn by the French Cartographer Louis-Alexandre Berthier contained hinged overlays to show troop movements
o the mid-19th Century "Atlas to Accompany the Second report of the Irish Railway Commissioners" showed population, traffic flow, geology and topography superimposed on the same base map
o Dr. John Snow used a map showing the locations of death by cholera in central London in September, 1854 to track the source of the outbreak to a contaminated well - an early example of geographical analysis
C. EARLY COMPUTER ERA
several factors caused a change in cartographic analysis:
o computer technology - improvements in hardware, esp. graphics
o development of theories of spatial processes in economic and social geography, anthropology, regional science
o increasing social awareness, education levels and mobility, awareness of environmental problems
integrated transportation plans of 1950s and 60s in Detroit, Chicago
o required integration of transportation information - routes, destinations, origins, time
o produced maps of traffic flow and volume
University of Washington, Department of Geography, research on advanced statistical methods, rudimentary computer programming, computer cartography, most active 1958-611:
o Nystuen - fundamental spatial concepts - distance, orientation, connectivity
o Tobler - computer algorithms for map projections, computer cartography
o Bunge - theoretical geography - geometric basis for geography - points, lines and areas
o Berry''s Geographical Matrix of places by characteristics (attributes) - regional studies by overlaying maps of different themes - systematic studies by detailed evaluation of a single layer
D. CANADA GEOGRAPHIC INFORMATION SYSTEM (CGIS)
Canada Geographic Information System is an example of one of the earliest GISs developed, started in the mid ''60''s
is a large scale system still operating today
its development provided many conceptual and technical contributions
Purpose
to analyze the data collected by the Canada Land Inventory (CLI) and to produce statistics to be used in developing land management plans for large areas of rural Canada
the CLI created maps which:
o classify land using various themes: soil capability for agriculture recreation capability capability for wildlife (ungulates) capability for wildlife (waterfowl) forestry capability present land use shoreline
o were developed at map scales of 1:50,000
o use a simple rating scheme, 1 (best) to 7 (poorest), with detailed qualification codes, e.g. on soils map
____________________ 1see pages 62-66 in Johnston, R.J., 1983. Geography and Geographers: Anglo-American Human Geography since 1945, 2nd edition, Edward Arnold (Publishers), London.
may indicate bedrock, shallow soil, alkaline conditions
product of CLI was 7 primary map layers, each showing area objects with homogeneous attributes
o other map layers were developed subsequently, e.g. census reporting zones
perception was that computers could perform analyses once the data had been input
Technological innovations
CGIS required the development of new technology
o no previous experience in how to structure data internally
o no precedent for GIS operations of overlay, area measurement
o experimental scanner had to be built for map input
very high costs of technical development
o cost-benefit studies done to justify the project were initially convincing
o major cost over-runs
o analysis behind schedule
by 1970 project was in trouble
o failure to deliver promised tabulations, capabilities
completion of database, product generation under way by mid 1970s
o main product was statistical summaries of the area with various combinations of themes
o later enhancement allowed output of simple maps
CGIS still highly regarded in late 1970s, early 1980s as center of technological excellence despite aging of database
o attempts were made to adapt the system to new data
o new functionality added, especially networking capability and remote access
o however, this was too late to compete with the new vendor products of 1980s
Key innovative ideas in CGIS
overhead - Key ideas in CGIS
use of scanning for input of high density area objects
o maps had to be redrafted (scribed) for scanning
o note: scribing is as labor intensive as digitizing
vectorization of scanned images
geographical partitioning of data into "map sheets" or "tiles" but with edgematching across tile boundaries
partitioning of data into themes or layers
use of absolute system of coordinates for entire country with precision adjustable to resolution of data
o number of digits of precision can be set by the system manager and changed from layer to layer
internal representation of line objects as chains of incremental moves in 8 compass directions rather than straight lines between points (Freeman chain code)
coding of area object boundaries by arc, with pointers to left and right area objects
o first "topological" system with planar enforcement in each layer, relationships between arcs and areas coded in the database
separation of data into attribute and locational files
o "descriptor dataset" (DDS) and "image dataset" (IDS)
o concept of an attribute table
implementation of functions for polygon overlay, measurement of area, user-defined circles and polygons for query
Key individual
Roger Tomlinson, now with Tomlinson Associates, Ottawa
E. HARVARD LABORATORY
full name - Harvard Laboratory For Computer Graphics And Spatial Analysis
Howard Fisher, moved from Chicago to establish a lab at Harvard, initially to develop general-purpose mapping software - mid 1960s
Harvard Lab for Computer Graphics and Spatial Analysis had major influence on the development of GIS until early 1980s, still continues at smaller scale
Harvard software was widely distributed and helped to build the application base for GIS
many pioneers of newer GIS "grew up" at the Harvard lab
The Harvard packages
overhead - The Harvard packages
SYMAP
o developed as general-purpose mapping package beginning in 1964
o output exclusively on line printer
 poor resolution, low quality
o limited functionality but simple to use
 a way for the non-cartographer to make maps
o first real demonstration of ability of computers to make maps
o sparked enormous interest in a previously unheard-of technology
CALFORM (late 1960s)
o SYMAP on a plotter
o user avoided double-coding of internal boundaries by inputting a table of point locations, plus a set of polygons defined by sequences of point IDs
o more cosmetic than SYMAP - North arrows, better legends
SYMVU (late 1960s)
o 3D perspective views of SYMAP output
o first new form of display of spatial data to come out of a computer
GRID (late 1960s)
o raster cells could be displayed using the same output techniques as SYMAP
o later developed to allow multiple input layers of raster cells, beginnings of raster GIS
o used to implement the ideas of overlay from landscape architecture and McHarg
POLYVRT (early 1970s)
o converted between various alternative ways of forming area objects: SYMAP - every polygon separately, internal boundaries twice CALFORM - table of point locations plus lists of IDs DIME - see below
o motivated by need of computer mapping packages for flexible input, transfer of boundary files between systems, growing supply of data in digital form, e.g. from Bureau of the Census
ODYSSEY (mid 1970s)
o extended POLYVRT idea beyond format conversion to a comprehensive analysis package based on vector data
o first robust, efficient algorithm for polygon overlay - included sliver removal
Key individuals
Howard Fisher - initiated Lab, development of SYMAP
William Warntz - succeeded Fisher as Director until 1971, developed techniques, theories of spatial analysis based on computer handling of spatial data
Scott Morehouse - move to ESRI was key link between ODYSSEY and the development of ARC/INFO
see Chrisman (1988) for additional information on the Lab and its key personnel
F. BUREAU OF THE CENSUS
need for a method of assigning census returns to correct geographical location
o address matching to convert street addresses to geographic coordinates and census reporting zones
o with geographic coordinates, data could be aggregated to user-specified custom reporting zones
need for a comprehensive approach to census geography
o reporting zones are hierarchically related
o e.g. enumeration districts nest within census tracts
1970 was the first geocoded census
DIME files were the major component of the geocoding approach
DIME files
precursor to TIGER, urban areas only
coded street segments between intersections using
o IDs of right and left blocks
o IDs of from and to nodes (intersections)
o x,y coordinates
o address ranges on each side
this is essentially the arc structure of CGIS and the internal structure (common denominator format) of POLYVRT
DIME files were very widely distributed and used as the basis for numerous applications
topological ideas of DIME were refined into TIGER model
o planar enforcement
o 0-, 1- and 2-cell terminology
DIME, TIGER were influential in stimulating development work on products which rely on street network databases
o automobile navigation systems
o driver guides to generate text driving instructions (e.g. auto rental agencies)
o garbage truck routing
o emergency vehicle dispatching
Urban atlases
beginning with the 1970 census
production of "atlases" of computer-generated maps for selected census variables for selected cities
demonstrated the value of simple computer maps for marketing, retailing applications
o stimulated development of current range of PC-based statistical mapping packages
based on use of digital boundary files produced by the Bureau
G. ESRI
Jack Dangermond founded Environmental Systems Research Institute in 1969 based on techniques, ideas being developed at Harvard Lab and elsewhere
1970s period of slow growth based on various raster and vector systems
early 1980s release of ARC/INFO
o successful implementation of CGIS idea of separate attribute and locational information
o successful marriage of standard relational database management system (INFO) to handle attribute tables with specialized software to handle objects stored as arcs (ARC) - a basic design which has been copied in many other systems
o "toolbox", command-driven, product-oriented user interface
 modular design allowed elaborate applications to be built on top of toolbox
ARC/INFO was the first GIS to take advantage of new super-mini hardware
o GIS could now be supported by a platform which was affordable to many resource management agencies
o emphasis on independence from specific platforms, operating systems
initial successes in forestry applications, later diversification to many GIS markets
o expansion to $40 million company by 1988
REFERENCES
Special issue of The American Cartographer Vol 15(3), 1988, on the digital revolution in cartography - contains articles on the Harvard Lab, UK Experimental Cartography Unit, and the history of GIS.
Tomlinson, R.F., 1987. "Current and potential uses of geographical information systems," The North American experience. International Journal of Geographical Information Systems 1:203-18. Reviews GIS from beginnings to 1987, and summarizes lessons learned.
Three-dimensional GIS
To more realistically analyze the effect of the Earth''s terrain, we use three-dimensional models within a GIS. A GIS can display the Earth in realistic, three-dimensional perspective views and animations that convey information more effectively and to wider audiences than traditional, two-dimensional, static maps. The U.S. Forest Service was offered a land swap by a mining company seeking development rights to a mineral deposit in Arizona''s Prescott National Forest. Using a GIS, the USGS and the U.S. Forest Service created perspective views of the area to depict the terrain as it would appear after mining (fig. 25).
To assess the potential hazard of landslides both on land and underwater, the USGS generated a three-dimensional image of the San Francisco Bay area (fig. 26). It created the image by mosaicking eight scenes of natural color composite Landsat 7 enhanced thematic mapper imagery on California fault data using approximately 700 digital elevation models at 1:24,000 scale.
Graphic display techniques
Traditional maps are abstractions of the real world; each map is a sampling of important elements portrayed on a sheet of paper with symbols to represent physical objects. People who use maps must interpret these symbols. Topographic maps show the shape of the land surface with contour lines. Graphic display techniques in GISs make relationships among map elements more visible, heightening one''s ability to extract and analyze information.
Two types of data were combined in a GIS to produce a perspective view of a part of San Mateo County, Calif. The digital elevation model, consisting of surface elevations recorded on a 30-meter horizontal grid, shows high elevations as white and low elevations as black (
