 | Data structures |
Example of the structure of a raster file. |
Example of the structure of a vector data file |
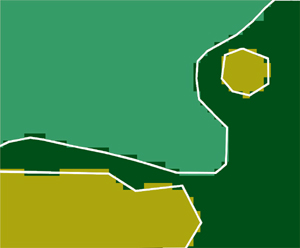
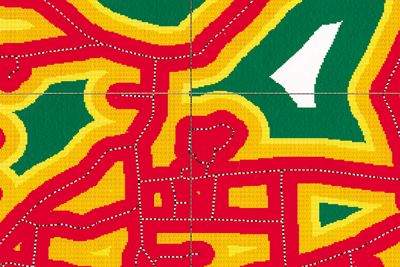
Magnified view of the same GIS data file, shown in raster format. |
Magnified views of the same GIS data file. converted into vector format. |
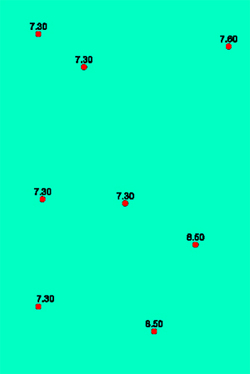
Points with pH values of oil |
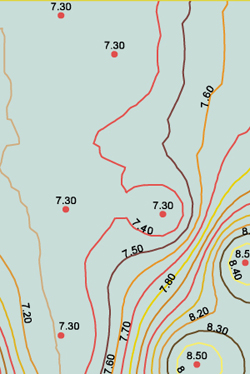
Contour map made from soil pH values shown in figure 14 |
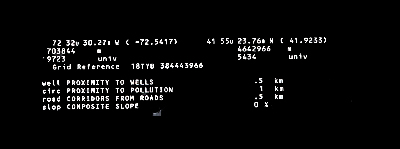
A crosshair pointer (top) can be used to point at a location stored in a GIS. The bottom illustration depicts a computer screen containing the kind of information stored about the locationŚfor example, the latitude, longitude, projection, coordinates, closeness to wells, sources of production, roads, and slopes of land. |
|
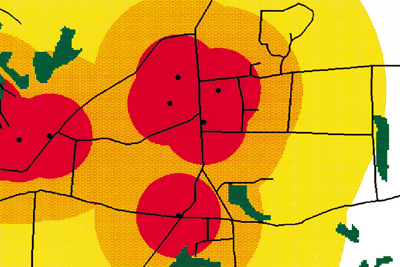
Sources of pollution are represented as points. The colored circles show distance from pollution sources and the wetlands are in dark green |
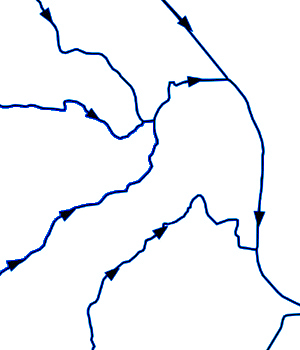
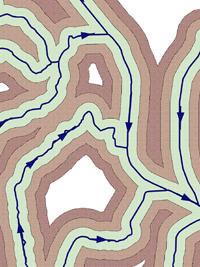
A GIS can simulate the movement of materials along a network of lines. These illustrations show the route of pollutants through a stream system. Flow directions are indicated by arrows. |
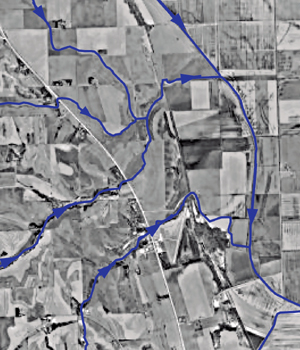
Flow superimposed on a digital orthophoquad of the area |
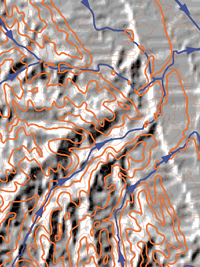
Figure 19a. Shaded-relief map and contour lines generated from the digital elevation model in the study area |
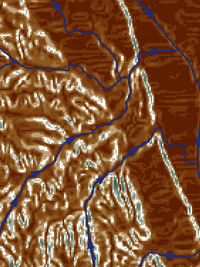
Figure 19b. Map showing the steepness of slopes in the study area, created by GIS from the digital elevation model. |
Figure 19c. Distances to streams as measured by three 200-meter buffers derived from a digital map of hydrography. |
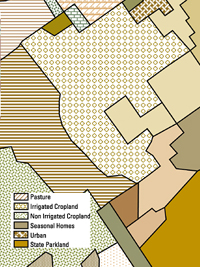
Figure 19d. Map indicating various land uses in the study area. |
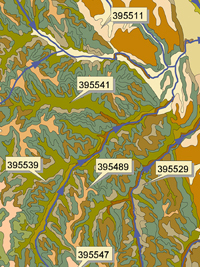
Figure 19e. A soils map stored in a GIS database. Numbers indicate the type of soil. |
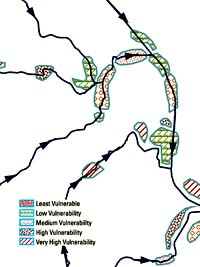
Figure 19f. The wetlands in the study area ranked according to their vulnerability to pollution on the basis of combination of factors evaluated by GIS. |
Figure 20. Examples of finished maps that can be generated using a GIS, showing human-built and physical features. |
Examples of finished maps that can be generated using a GIS, showing landforms and geology |
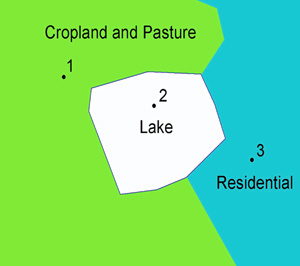

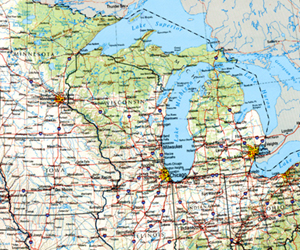
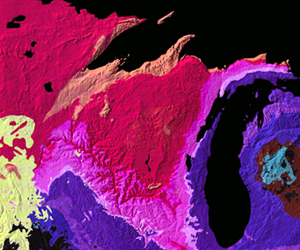
Can a land use map be related to a satellite image, a timely indicator of land use? Yes, but because digital data are collected and stored in different ways, the two data sources may not be entirely compatible. Therefore, a GIS must be able to convert data from one structure to another.
Satellite image data that have been interpreted by a computer to produce a land use map can be "read into" the GIS in raster format. Raster data files consist of rows of uniform cells coded according to data values. An example is land cover classification (fig. 11). Raster files can be manipulated quickly by the computer, but they are often less detailed and may be less visually appealing than vector data files, which can approximate the appearance of more traditional hand-drafted maps. Vector digital data have been captured as points, lines (a series of point coordinates), or areas (shapes bounded by lines) (fig. 12). An example of data typically held in a vector file would be the property boundaries for a particular housing subdivision.
Data restructuring can be performed by a GIS to convert data between different formats. For example, a GIS can be used to convert a satellite image map to a vector structure by generating lines around all cells with the same classification, while determining the spatial relationships of the cell, such as adjacency or inclusion
Data modeling
It is impossible to collect data over every square meter of the Earth''s surface. Therefore, samples must be taken at discrete locations. A GIS can be used to depict two- and three-dimensional characteristics of the Earth''s surface, subsurface, and atmosphere from points where samples have been collected.
For example, a GIS can quickly generate a map with isolines that indicate the pH of soil from test points (figs. 14 and 15). Such a map can be thought of as a soil pH contour map. Many sophisticated methods can estimate the characteristics of surfaces from a limited number of point measurements. Two- and three-dimensional contour maps created from the surface modeling of sample points from pH measurements can be analyzed together with any other map in a GIS covering the area.
Information retrieval
What do you know about the swampy area at the end of your street? With a GIS you can "point" at a location, object, or area on the screen and retrieve recorded information about it from offscreen files (fig. 16). Using scanned aerial photographs as a visual guide, you can ask a GIS about the geology or hydrology of the area or even about how close a swamp is to the end of a street. This type of analysis allows you to draw conclusions about the swamp''s environmental sensitivity.
Topological modeling
Have there ever been gas stations or factories that operated next to the swamp? Were any of these uphill from and within 2 miles of the swamp? A GIS can recognize and analyze the spatial relationships among mapped phenomena. Conditions of adjacency (what is next to what), containment (what is enclosed by what), and proximity (how close something is to something else) can be determined with a GIS.
Networks
When nutrients from farmland are running off into streams, it is important to know in which direction the streams flow and which streams empty into other streams. This is done by using a linear network. It allows the computer to determine how the nutrients are transported downstream. Additional information on water volume and speed throughout the spatial network can help the GIS determine how long it will take the nutrients to travel downstream
Overlay
Using maps of wetlands, slopes, streams, land use, and soils (figs. 19a-f), the GIS might produce a new map layer or overlay that ranks the wetlands according to their relative sensitivity to damage from nutrient runoff.
Data output
A critical component of a GIS is its ability to produce graphics on the screen or on paper to convey the results of analyses to the people who make decisions about resources. Wall maps, Internet-ready maps, interactive maps, and other graphics can be generated, allowing the decisionmakers to visualize and thereby understand the results of analyses or simulations of potential events (fig. 20).
Framework for cooperation
The use of a GIS can encourage cooperation and communication among the organizations involved in environmental protection, planning, and resource management. The collection of data for a GIS is costly. Data collection can require very specialized computer equipment and technical expertise.
Standard data formats ease the exchange of digital information among users of different systems. Standardization helps to stretch data collection funds further by allowing data sharing, and, in many cases, gives users access to data that they could not otherwise collect for economic or technical reasons. Organizations such as the University Consortium for Geographic Information Science (www.ucgis.org) and the Federal Geographic Data Committee (www.fgdc.gov) seek to encourage standardization efforts.
For more information
Good places to learn more about GIS technology and methods include the geography department of your local university, the GIS site at www.gis.com, your county planning department, your state department of natural resources, or a USGS Earth Science Information Center (ESIC). To locate your nearest ESIC, call 1-888-ASK-USGS, visit ASK-USGS web site, or visit www.usgs.gov.
The Federal Geographic Data Committee
UCGIS
GIS
USGS
Ask USGS