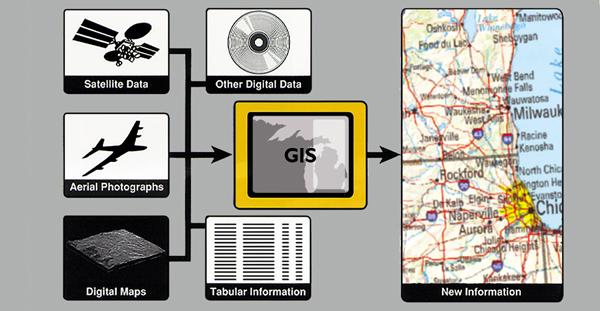
 | How does a GIS work |
U.S. Geological Survey (USGS) |
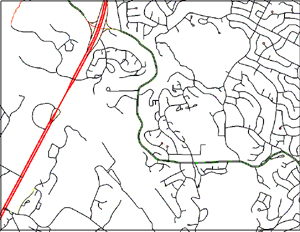
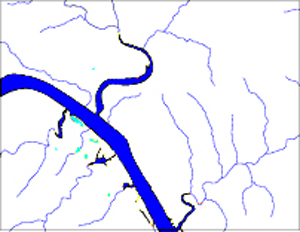
USGS DLG of rivers |
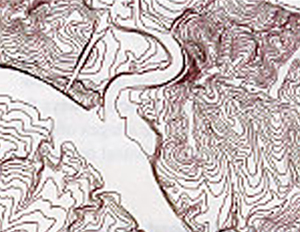
USGS DLG of contour lines (hypsography). |
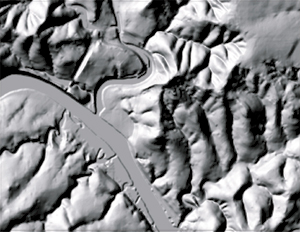
USGS digital elevation (DEM). |
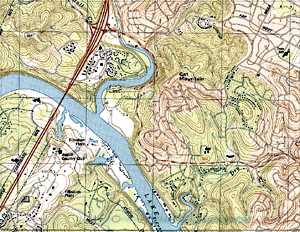
USGS scanned, rectified topographic map called a digital raster graphic (DRG). |
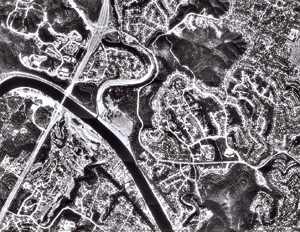
USGS digital orthophoto quadrangle (DOQ). |
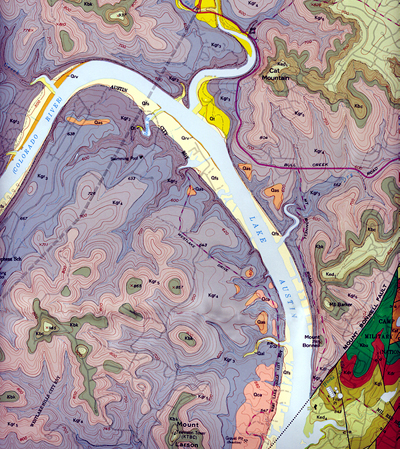
USGS geologic map |
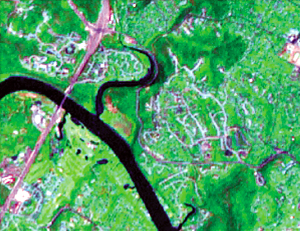
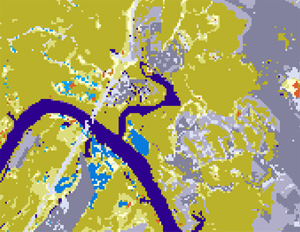
Landsat 7 satellite image from which land cover information can be derived |
Satellite image data in figure 3 have been analyzed to indicate classes of land uses and cover |
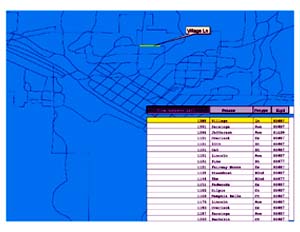
Part of a census data file containing address information |
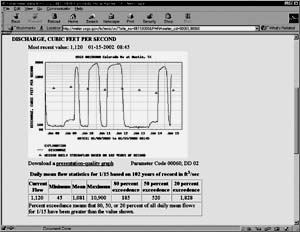
Part of a hydrologic data report indicating the discharge and amount of river flow recorded by a particular streamgage that has a known location. |
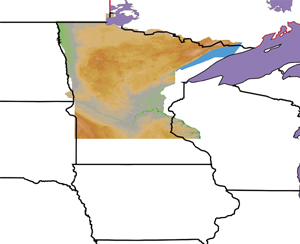
Data integration is the linking of information in different forms through a GIS |
An elevation image classified from a satellite image of Minnesota exists in a different scale and projection than the lines on the digital file of the State and province boundaries. |
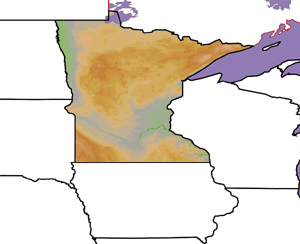
The elevation image has been reprojected to match the projection and scale of the State and province boundaries |
1. Relating information from different sources
2. Data capture (Scanning paper maps, Collecting latitude and longitude coordinates with a Global Positioning System (GPS) receiver)
3.Projection and registration