 | Experimental biology |
plant reproductive biology: the life cycle of higher plants -http://bio.fsu.edu/~winn/3402L/WinnCH3.html |
plant reproductive biology:Separation in Time - two different types of flowers, one having long styles and stamens low in the floral tube |
Statistics:ch7-http://bio.fsu.edu/~winn/3402L/WinnCH7.html |
Statistics:ch7-http://bio.fsu.edu/~winn/3402L/WinnCH7.html |
Statistics:ch7-http://bio.fsu.edu/~winn/3402L/WinnCH7.html |
Statistics:ch7-http://bio.fsu.edu/~winn/3402L/WinnCH7.html |
Statistics:ch7-http://bio.fsu.edu/~winn/3402L/WinnCH7.html |
Statistics:ch7-http://bio.fsu.edu/~winn/3402L/WinnCH7.html |
Statistics:ch7-http://bio.fsu.edu/~winn/3402L/WinnCH7.html |
data for bees ch8 |
The relationship between time spent by a bee on a flower and seeds per pod produced by that flower |
Arrange the data by XY pairs and determine the following values |
Compute the slope, b, by this formula ch8 |
Compute a, the intercept where X = 0 ch8 |
Place the values you have calculated into this equation Y = a + bX and Compute the total sum of the squares of the Y values (SST) |
Compute the sum of the squares due to regression (SSr)- http://bio.fsu.edu/~winn/3402L/WinnCH8.html |
Compute the sum of squares due to error (SSE) = SST - SSr, divide the SSr and the SSE by the appropriate degrees of freedom to get the variance for each (the Vr and the VE). Thedegrees of freedom for SSr are always 1. Therefore, SSr = Vr. The degrees of freedom for SSE = n - 2.Therefore, the formula for the variance due to error is |
The last step is to calculate an F statistic using the formula - http://bio.fsu.edu/~winn/3402L/WinnCH8.html |
fig.8.2 The data on seeds/pod and time/flower above produce the significant relationship - http://bio.fsu.edu/~winn/3402L/WinnCH8.html |
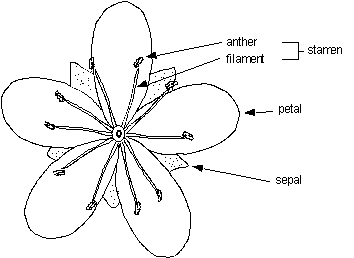
Ch12 A typical angiosperm flower viewed from above |
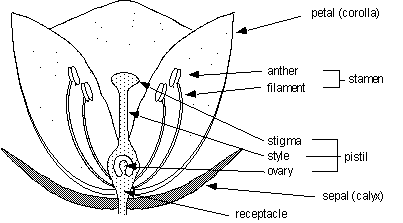
Ch12 A cross section of a typical angiosperm flower, showing details of male and female portions of the flower |
Ch12 -For each flower, start with a list of all the options |
Then go through each of the floral characteristics below, crossing out systems that could not be involved (those listed in parentheses areunlikely, but possible candidates). For example, if the flower color is red, you would cross off your worksheet all the systems listed after red. The pollination system(s) that is (are) not crossed off your list is (are) the most likely candidate(s) for that particular species |
the structure of two flowers |
Ch 13 http://bio.fsu.edu/~winn/3402L/WinnCH13.html |
http://bio.fsu.edu/~winn/3402L/WinnCH13.html |
CHapter 12 - http://bio.fsu.edu/~winn/3402L/WinnCH12.html
The pollination systems addressed in this key are abbreviated as:
Abiotic systems (water pollination is not addressed in this key)
WI wind pollination
Insects
BT beetles
F-M flies (myophily)
F-S flies (sapromyophily)
BE bees
BU butterflies
MO moths
Vertebrates
BI birds
BA bats
This key is used to eliminate unlikely pollinators. Use this key to determine the most likely pollination system for at least two flowers provided for this purpose by the Teaching Assistant.
see pictures for ch12 abowe.
1. Neatly diagram the structure of two flowers that appear different to you. On each one, label the following structures: anther, filament, stigma, style, ovary, petal, sepal (if present).
2. Sketch one entire inflorescence and label an individual flower.
3. For two different flowers, use the Key to Pollination Systems to identify the most likely pollinator of that flower. For each flower, describe what traits you used to eliminate three specific other possible pollinators (e.g. the presence of a fruity scent may lead you to eliminate birds as a possible pollinator).


